
Indicator Gauge Icon Legend
Legend Colors
Red is bad, green is good, blue is not statistically different/neutral.
Compared to Distribution
 the value is in the best half of communities.
 the value is in the 2nd worst quarter of communities.
 the value is in the worst quarter of communities.
Compared to Target
 meets target;
  does not meet target.
Compared to a Single Value
 lower than the comparison value;
 higher than the comparison value;
 not statistically different from comparison value.
Trend

 non-significant change over time;
 significant change over time;
  no change over time.
Compared to Prior Value
 higher than the previous measurement period;
 lower than the previous measurement period;
 no statistically different change from previous measurement period.
 Significantly better than the overall value
 Significantly worse than the overall value
 No significant difference with the overall value
 No data on significance available
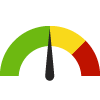
Preterm Births
Measurement Period: 2019
This indicator is archived and is no longer being updated. Click to learn more
This indicator shows the percentage of births with less than 37 weeks of completed gestation.
Why is this important?
Infants born before 37 weeks may be born with serious health problems and have higher risk of infections, developmental problems, breathing problems, and death (The American College of Obstetricians and Gynecologists, Centers for Disease Control and Prevention). Strategies to reduce preterm births include promoting adequate birth spacing, helping pregnant people quit smoking, and providing high-quality medical care for pregnant patients (Healthy People 2030).
Considerations for Equitable Approaches: Nationally, there are racial and ethnic differences in preterm birth rates, with higher rates among non-Hispanic Black births. In addition to medical conditions and behavioral factors (e.g., tobacco use, substance use, stress), known factors that may increase the likelihood of early delivery include social, personal, and economic characteristics such as race and income. Exploring broader social policies to improve the health of pregnant people, particularly in African American and other communities at high risk, could reduce preterm birth and associated disparities (Centers for Disease Control and Prevention).
Inclusive Language Recommendations: As not all people who are pregnant identify as women, recommendations for more gender-inclusive language include using "pregnant people" and "pregnant patients" or other wording as applicable when referring to general recommendations for pregnancy (National Institutes of Health).
The Healthy People 2030 national health target is to reduce preterm births to 9.4 percent.
13.2%
Source:
Texas Department of State Health Services
Measurement period: 2019
Maintained by: Conduent Healthy Communities Institute
Last update: October 2022
Measurement period: 2019
Maintained by: Conduent Healthy Communities Institute
Last update: October 2022


Graph Selections

Data Source
- Texas Department of State Health Services
Maintained By: Conduent Healthy Communities Institute (Methodology)
Filed under: Health / Maternal, Fetal & Infant Health, Health Outcomes, Infants