
Search for Indicators
CHIP Priority Indicators
Optional narrative text. Can also limit the # of comparisons that we display in the dashboard i.e. only show compare to TX value OR could add in a CHIP target value.
Indicator Gauge Icon Legend
Legend Colors
Red is bad, green is good, blue is not statistically different/neutral.
Compared to Distribution
 the value is in the best half of communities.
 the value is in the 2nd worst quarter of communities.
 the value is in the worst quarter of communities.
Compared to Target
 meets target;
  does not meet target.
Compared to a Single Value
 lower than the comparison value;
 higher than the comparison value;
 not statistically different from comparison value.
Trend

 non-significant change over time;
 significant change over time;
  no change over time.
Compared to Prior Value
 higher than the previous measurement period;
 lower than the previous measurement period;
 no statistically different change from previous measurement period.
County: Harris
Access to Care
Value
Compared to:
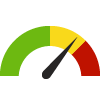
County: Harris Adults who have had a Routine Checkup
County: Harris Adults who have had a Routine Checkup
70.5%
(2021)
Compared to:


TX Counties
The distribution is based on data from 254 Texas counties.
U.S. Counties
The distribution is based on data from 3,074 U.S. counties and county equivalents.
US Value
(73.6%)
The regional value is compared to the national value.
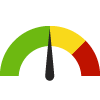
County: Harris Adults Unable to Afford to See a Doctor
County: Harris Adults Unable to Afford to See a Doctor
16.1%
(2021)
Compared to:

TX Value
(15.9%)
The regional value is compared to the Texas State value.
Prior Value
(18.3%)
Prior Value compares a measured value with the previously measured value. Confidence intervals were taken into account in determining the direction of the comparison.
Trend
This comparison measures the indicator’s values over multiple time periods.<br>The Mann-Kendall Test for Statistical Significance is used to evaluate the trend<br>over 4 to 10 periods of measure, subject to data availability and comparability.
County: Harris Primary Care Provider Rate
County: Harris Primary Care Provider Rate
58
Providers per 100,000 population
(2021)
Compared to:

TX Counties
The distribution is based on data from 231 Texas counties.
U.S. Counties
The distribution is based on data from 2,984 U.S. counties and county equivalents.
TX Value
(60)
The regional value is compared to the Texas State value.
Prior Value
(59)
Prior Value compares a measured value with the previously measured value. Confidence intervals were not taken into account in determining the direction of the comparison.
Trend
This comparison measures the indicator’s values over multiple time periods.<br>The Mann-Kendall Test for Statistical Significance is used to evaluate the trend<br>over 4 to 10 periods of measure, subject to data availability and comparability.
County: Harris Non-Physician Primary Care Provider Rate
County: Harris Non-Physician Primary Care Provider Rate
121
Providers per 100,000 population
(2023)
Compared to:
TX Counties
The distribution is based on data from 252 Texas counties.
U.S. Counties
The distribution is based on data from 3,129 U.S. counties and county equivalents.
TX Value
(109)
The regional value is compared to the Texas State value.
Prior Value
(115)
Prior Value compares a measured value with the previously measured value. Confidence intervals were not taken into account in determining the direction of the comparison.
Trend
This comparison measures the indicator’s values over multiple time periods.<br>The Mann-Kendall Test for Statistical Significance is used to evaluate the trend<br>over 4 to 10 periods of measure, subject to data availability and comparability.
County: Harris Children with Health Insurance
County: Harris Children with Health Insurance
87.2%
(2022)
Compared to:

U.S. Counties
The distribution is based on data from 828 U.S. counties and county equivalents.
TX Value
(89.1%)
The regional value is compared to the Texas State value.
US Value
(94.9%)
The regional value is compared to the national value.
Prior Value
(85.4%)
Prior Value compares a measured value with the previously measured value. Confidence intervals were taken into account in determining the direction of the comparison.
Trend
This comparison measures the indicator’s values over multiple time periods.<br>The Mann-Kendall Test for Statistical Significance is used to evaluate the trend<br>over 4 to 10 periods of measure, subject to data availability and comparability.
County: Harris Adults with Health Insurance
County: Harris Adults with Health Insurance
73.0%
(2022)
Compared to:
U.S. Counties
The distribution is based on data from 828 U.S. counties and county equivalents.
TX Value
(77.6%)
The regional value is compared to the Texas State value.
US Value
(88.7%)
The regional value is compared to the national value.
Prior Value
(71.4%)
Prior Value compares a measured value with the previously measured value. Confidence intervals were taken into account in determining the direction of the comparison.
Trend
This comparison measures the indicator’s values over multiple time periods.<br>The Mann-Kendall Test for Statistical Significance is used to evaluate the trend<br>over 4 to 10 periods of measure, subject to data availability and comparability.
County: Harris Persons with Health Insurance
County: Harris Persons with Health Insurance
76.2%
(2021)
Compared to:
TX Counties
The distribution is based on data from 254 Texas counties.
U.S. Counties
The distribution is based on data from 3,140 U.S. counties and county equivalents.
TX Value
(79.7%)
The regional value is compared to the Texas State value.
Prior Value
(77.6%)
Prior Value compares a measured value with the previously measured value. Confidence intervals were taken into account in determining the direction of the comparison.
Trend
This comparison measures the indicator’s values over multiple time periods.<br>The Mann-Kendall Test for Statistical Significance is used to evaluate the trend<br>over 4 to 10 periods of measure, subject to data availability and comparability.
HP 2030 Target
(92.4%)
<div>AHS-01: Increase the proportion of people with health insurance <strong>(LEADING HEALTH INDICATOR)</strong></div>
County: Harris Persons with Private Health Insurance Only
County: Harris Persons with Private Health Insurance Only
50.0%
(2022)
Compared to:


TX Value
(53.8%)
The regional value is compared to the Texas State value.
US Value
(54.8%)
The regional value is compared to the national value.
Prior Value
(48.5%)
Prior Value compares a measured value with the previously measured value. Confidence intervals were not taken into account in determining the direction of the comparison.
Trend
This comparison measures the indicator’s values over multiple time periods.<br>The Mann-Kendall Test for Statistical Significance is used to evaluate the trend<br>over 4 to 10 periods of measure, subject to data availability and comparability.
County: Harris Adults who Visited a Dentist
County: Harris Adults who Visited a Dentist
59.6%
(2012)
Compared to:
TX Value
(58.8%)
The regional value is compared to the Texas State value.
US Value
(67.2%)
The regional value is compared to the national value.
County: Harris Persons with Public Health Insurance Only
County: Harris Persons with Public Health Insurance Only
22.8%
(2022)
Compared to:


TX Value
(20.6%)
The regional value is compared to the Texas State value.
US Value
(24.8%)
The regional value is compared to the national value.
Prior Value
(22.7%)
Prior Value compares a measured value with the previously measured value. Confidence intervals were not taken into account in determining the direction of the comparison.
Trend
This comparison measures the indicator’s values over multiple time periods.<br>The Mann-Kendall Test for Statistical Significance is used to evaluate the trend<br>over 4 to 10 periods of measure, subject to data availability and comparability.
County: Harris Dentist Rate
County: Harris Dentist Rate
74
Dentists per 100,000 population
(2022)
Compared to:
TX Counties
The distribution is based on data from 242 Texas counties.
U.S. Counties
The distribution is based on data from 3,054 U.S. counties and county equivalents.
TX Value
(63)
The regional value is compared to the Texas State value.
Prior Value
(74)
Prior Value compares a measured value with the previously measured value. Confidence intervals were not taken into account in determining the direction of the comparison.
Trend
This comparison measures the indicator’s values over multiple time periods.<br>The Mann-Kendall Test for Statistical Significance is used to evaluate the trend<br>over 4 to 10 periods of measure, subject to data availability and comparability.
County: Harris
Chronic Disease
Value
Compared to:
County: Harris Adults with Current Asthma
County: Harris Adults with Current Asthma
7.0%
(2021)
Compared to:

TX Value
(8.4%)
The regional value is compared to the Texas State value.
US Value
(9.8%)
The regional value is compared to the national value. The source for the national value is Behavioral Risk Factor Surveillance System
Prior Value
(4.7%)
Prior Value compares a measured value with the previously measured value. Confidence intervals were taken into account in determining the direction of the comparison.
Trend
This comparison measures the indicator’s values over multiple time periods.<br>The Mann-Kendall Test for Statistical Significance is used to evaluate the trend<br>over 4 to 10 periods of measure, subject to data availability and comparability.
County: Harris Asthma: Medicare Population
County: Harris Asthma: Medicare Population
6.0%
(2022)
Compared to:
TX Counties
The distribution is based on data from 254 Texas counties.
U.S. Counties
The distribution is based on data from 3,129 U.S. counties and county equivalents.
TX Value
(7.0%)
The regional value is compared to the Texas State value.
US Value
(7.0%)
The regional value is compared to the national value.
Prior Value
(6.0%)
Prior Value compares a measured value with the previously measured value. Confidence intervals were not taken into account in determining the direction of the comparison.
Trend
This comparison measures the indicator’s values over multiple time periods.<br>The Mann-Kendall Test for Statistical Significance is used to evaluate the trend<br>over 4 to 10 periods of measure, subject to data availability and comparability.
County: Harris Adults with Kidney Disease
County: Harris Adults with Kidney Disease
3.1%
(2021)
Compared to:
TX Counties
The distribution is based on data from 254 Texas counties.
U.S. Counties
The distribution is based on data from 3,074 U.S. counties and county equivalents.
US Value
(3.1%)
The regional value is compared to the national value.
County: Harris Chronic Kidney Disease: Medicare Population
County: Harris Chronic Kidney Disease: Medicare Population
18.0%
(2022)
Compared to:
TX Counties
The distribution is based on data from 254 Texas counties.
U.S. Counties
The distribution is based on data from 3,129 U.S. counties and county equivalents.
TX Value
(18.0%)
The regional value is compared to the Texas State value.
US Value
(18.0%)
The regional value is compared to the national value.
Prior Value
(18.0%)
Prior Value compares a measured value with the previously measured value. Confidence intervals were not taken into account in determining the direction of the comparison.
Trend
This comparison measures the indicator’s values over multiple time periods.<br>The Mann-Kendall Test for Statistical Significance is used to evaluate the trend<br>over 4 to 10 periods of measure, subject to data availability and comparability.
County: Harris Adults with Arthritis
County: Harris Adults with Arthritis
19.1%
(2021)
Compared to:
TX Counties
The distribution is based on data from 254 Texas counties.
U.S. Counties
The distribution is based on data from 3,074 U.S. counties and county equivalents.
US Value
(25.2%)
The regional value is compared to the national value.
County: Harris Osteoporosis: Medicare Population
County: Harris Osteoporosis: Medicare Population
12.0%
(2022)
Compared to:


TX Counties
The distribution is based on data from 254 Texas counties.
U.S. Counties
The distribution is based on data from 3,129 U.S. counties and county equivalents.
TX Value
(11.0%)
The regional value is compared to the Texas State value.
US Value
(11.0%)
The regional value is compared to the national value.
Prior Value
(11.0%)
Prior Value compares a measured value with the previously measured value. Confidence intervals were not taken into account in determining the direction of the comparison.
Trend
This comparison measures the indicator’s values over multiple time periods.<br>The Mann-Kendall Test for Statistical Significance is used to evaluate the trend<br>over 4 to 10 periods of measure, subject to data availability and comparability.
County: Harris Rheumatoid Arthritis or Osteoarthritis: Medicare Population
County: Harris Rheumatoid Arthritis or Osteoarthritis: Medicare Population
32.0%
(2022)
Compared to:
TX Counties
The distribution is based on data from 254 Texas counties.
U.S. Counties
The distribution is based on data from 3,129 U.S. counties and county equivalents.
TX Value
(35.0%)
The regional value is compared to the Texas State value.
US Value
(35.0%)
The regional value is compared to the national value.
Prior Value
(30.0%)
Prior Value compares a measured value with the previously measured value. Confidence intervals were not taken into account in determining the direction of the comparison.
Trend
This comparison measures the indicator’s values over multiple time periods.<br>The Mann-Kendall Test for Statistical Significance is used to evaluate the trend<br>over 4 to 10 periods of measure, subject to data availability and comparability.
County: Harris
Environmental Health
Value
Compared to:
County: Harris Annual Ozone Air Quality
County: Harris Annual Ozone Air Quality
5
(2019-2021)
Compared to:
Air Quality Index
The American Lung Association (ALA) assigns grades A-F to counties (A=1; B=2; C=3; D=4; F=5), based on average annual number of days that ozone levels exceeded U.S. standards during the three year measurement period. The five-point grading scale was used for the distribution (Green = <2; Yellow = 2 - 3; Red = >3). The air quality data is collected by the EPA and summarized by the ALA.
Prior Value
(5)
Prior Value compares a measured value with the previously measured value. Confidence intervals were not taken into account in determining the direction of the comparison.
Trend
This comparison measures the indicator’s values over multiple time periods.<br>The Mann-Kendall Test for Statistical Significance is used to evaluate the trend<br>over 4 to 10 periods of measure, subject to data availability and comparability.
County: Harris Annual Particle Pollution
County: Harris Annual Particle Pollution
3
(2019-2021)
Compared to:
Air Quality Index
The American Lung Association (ALA) assigns grades A-F to counties (A=1; B=2; C=3; D=4; F=5), based on average annual number of days that particle pollution levels exceeded U.S. standards during the three year measurement period. The five-point grading scale was used for the distribution (Green = <2; Yellow = 2 - 3; Red = >3). The air quality data is collected by the EPA and summarized by the ALA.
Prior Value
(4)
Prior Value compares a measured value with the previously measured value. Confidence intervals were not taken into account in determining the direction of the comparison.
Trend
This comparison measures the indicator’s values over multiple time periods.<br>The Mann-Kendall Test for Statistical Significance is used to evaluate the trend<br>over 4 to 10 periods of measure, subject to data availability and comparability.
County: Harris Recognized Carcinogens Released into Air
County: Harris Recognized Carcinogens Released into Air
2,556,912
Pounds
(2022)
Compared to:
Prior Value
(1,986,483)
Prior Value compares a measured value with the previously measured value. Confidence intervals were not taken into account in determining the direction of the comparison.
Trend
This comparison measures the indicator’s values over multiple time periods.<br>The Mann-Kendall Test for Statistical Significance is used to evaluate the trend<br>over 4 to 10 periods of measure, subject to data availability and comparability.
County: Harris PBT Released
County: Harris PBT Released
212,071
Pounds
(2022)
Compared to:
Prior Value
(306,327)
Prior Value compares a measured value with the previously measured value. Confidence intervals were not taken into account in determining the direction of the comparison.
Trend
This comparison measures the indicator’s values over multiple time periods.<br>The Mann-Kendall Test for Statistical Significance is used to evaluate the trend<br>over 4 to 10 periods of measure, subject to data availability and comparability.
County: Harris
Infectious Disease - HIV
Value
Compared to:
County: Harris HIV Diagnosis Rate
County: Harris HIV Diagnosis Rate
24.9
Cases per 100,000 population
(2019)
Compared to:
TX Counties
The distribution is based on data from 254 Texas counties.
TX Value
(14.5)
The regional value is compared to the Texas State value.
Prior Value
(25.4)
Prior Value compares a measured value with the previously measured value. Confidence intervals were not taken into account in determining the direction of the comparison.
Trend
This comparison measures the indicator’s values over multiple time periods.<br>The Mann-Kendall Test for Statistical Significance is used to evaluate the trend<br>over 4 to 10 periods of measure, subject to data availability and comparability.
County: Harris Gonorrhea Incidence Rate
County: Harris Gonorrhea Incidence Rate
185.8
Cases per 100,000 population
(2018)
Compared to:
TX Counties
The distribution is based on data from 254 Texas counties.
TX Value
(163.6)
The regional value is compared to the Texas State value.
US Value
(179.1)
The regional value is compared to the national value. The source for the national value is National Center for HIV/AIDS, Viral Hepatitis, STD, and TB Prevention
Prior Value
(182.1)
Prior Value compares a measured value with the previously measured value. Confidence intervals were not taken into account in determining the direction of the comparison.
Trend
This comparison measures the indicator’s values over multiple time periods.<br>The Mann-Kendall Test for Statistical Significance is used to evaluate the trend<br>over 4 to 10 periods of measure, subject to data availability and comparability.
County: Harris Syphilis Incidence Rate
County: Harris Syphilis Incidence Rate
12.0
Cases per 100,000 population
(2018)
Compared to:
TX Value
(8.8)
The regional value is compared to the Texas State value.
US Value
(10.8)
The regional value is compared to the national value. The source for the national value is National Center for HIV/AIDS, Viral Hepatitis, STD, and TB Prevention
Prior Value
(7.0)
Prior Value compares a measured value with the previously measured value. Confidence intervals were not taken into account in determining the direction of the comparison.
Trend
This comparison measures the indicator’s values over multiple time periods.<br>The Mann-Kendall Test for Statistical Significance is used to evaluate the trend<br>over 4 to 10 periods of measure, subject to data availability and comparability.
County: Harris Chlamydia Incidence Rate
County: Harris Chlamydia Incidence Rate
583.5
Cases per 100,000 population
(2018)
Compared to:
TX Counties
The distribution is based on data from 254 Texas counties.
TX Value
(508.2)
The regional value is compared to the Texas State value.
US Value
(539.9)
The regional value is compared to the national value. The source for the national value is National Center for HIV/AIDS, Viral Hepatitis, STD, and TB Prevention
Prior Value
(571.4)
Prior Value compares a measured value with the previously measured value. Confidence intervals were not taken into account in determining the direction of the comparison.
Trend
This comparison measures the indicator’s values over multiple time periods.<br>The Mann-Kendall Test for Statistical Significance is used to evaluate the trend<br>over 4 to 10 periods of measure, subject to data availability and comparability.
County: Harris Tuberculosis Incidence Rate
County: Harris Tuberculosis Incidence Rate
5.7
Cases per 100,000 population
(2017-2021)
Compared to:
TX Counties
The distribution is based on data from 254 Texas counties.
TX Value
(3.9)
The regional value is compared to the Texas State value.
US Value
(2.4 in 2021)
The regional value is compared to the national value. The source for the national value is Centers for Disease Control and Prevention
Prior Value
(5.7)
Prior Value compares a measured value with the previously measured value. Confidence intervals were not taken into account in determining the direction of the comparison.
Trend
This comparison measures the indicator’s values over multiple time periods.<br>The Mann-Kendall Test for Statistical Significance is used to evaluate the trend<br>over 4 to 10 periods of measure, subject to data availability and comparability.
HP 2030 Target
(1.4)
County: Harris Vaccine coverage rate for children 19-35 months
County: Harris Vaccine coverage rate for children 19-35 months
81.5%
(2016)
Compared to:
TX Value
(82.1%)
The regional value is compared to the Texas State value.
US Value
(84.6%)
The regional value is compared to the national value.
HP 2020 Target
(82.50%)
County: Harris Adults 65+ with Influenza Vaccination
County: Harris Adults 65+ with Influenza Vaccination
68.7%
(2021)
Compared to:
TX Value
(66.0%)
The regional value is compared to the Texas State value.
US Value
(68.6%)
The regional value is compared to the national value. The source for the national value is Behavioral Risk Factor Surveillance System
Prior Value
(72.8%)
Prior Value compares a measured value with the previously measured value. Confidence intervals were taken into account in determining the direction of the comparison.
Trend
This comparison measures the indicator’s values over multiple time periods.<br>The Mann-Kendall Test for Statistical Significance is used to evaluate the trend<br>over 4 to 10 periods of measure, subject to data availability and comparability.
County: Harris Adults 65+ with Pneumonia Vaccination
County: Harris Adults 65+ with Pneumonia Vaccination
65.4%
(2021)
Compared to:
TX Value
(69.0%)
The regional value is compared to the Texas State value.
US Value
(71.0%)
The regional value is compared to the national value. The source for the national value is Behavioral Risk Factor Surveillance System
Prior Value
(72.7%)
Prior Value compares a measured value with the previously measured value. Confidence intervals were taken into account in determining the direction of the comparison.
Trend
This comparison measures the indicator’s values over multiple time periods.<br>The Mann-Kendall Test for Statistical Significance is used to evaluate the trend<br>over 4 to 10 periods of measure, subject to data availability and comparability.
County: Harris Age-Adjusted Death Rate due to Influenza and Pneumonia
County: Harris Age-Adjusted Death Rate due to Influenza and Pneumonia
11.7
Deaths per 100,000 population
(2018-2020)
Compared to:
U.S. Counties
The distribution is based on data from 1,449 U.S. counties and county equivalents.
TX Value
(12.1)
The regional value is compared to the Texas State value.
US Value
(13.4)
The regional value is compared to the national value.
Prior Value
(12.1)
Prior Value compares a measured value with the previously measured value. Confidence intervals were taken into account in determining the direction of the comparison.
Trend
This comparison measures the indicator’s values over multiple time periods.<br>The Mann-Kendall Test for Statistical Significance is used to evaluate the trend<br>over 4 to 10 periods of measure, subject to data availability and comparability.
County: Harris
Maternal and Child Health
Value
Compared to:
County: Harris Infant Mortality Rate
County: Harris Infant Mortality Rate
5.9
Deaths per 1,000 live births
(2019)
Compared to:
TX Counties
(2015)
The distribution is based on data from 165 Texas counties.
TX Value
(5.5)
The regional value is compared to the Texas State value.
US Value
(5.6)
The regional value is compared to the national value. The source for the national value is Centers for Disease Control and Prevention
Prior Value
(6.0)
Prior Value compares a measured value with the previously measured value. Confidence intervals were not taken into account in determining the direction of the comparison.
Trend
This comparison measures the indicator’s values over multiple time periods.<br>The Mann-Kendall Test for Statistical Significance is used to evaluate the trend<br>over 4 to 10 periods of measure, subject to data availability and comparability.
HP 2030 Target
(5.0)
<div>MICH-02: Reduce the rate of infant deaths <strong>(LEADING HEALTH INDICATOR)</strong></div>
County: Harris Babies with Very Low Birthweight
County: Harris Babies with Very Low Birthweight
1.5%
(2015)
Compared to:
TX Value
(1.4% in 2013)
The regional value is compared to the Texas State value.
US Value
(1.4%)
The regional value is compared to the national value. The source for the national value is Centers for Disease Control and Prevention
Prior Value
(1.5%)
Prior Value compares a measured value with the previously measured value. Confidence intervals were not taken into account in determining the direction of the comparison.
Trend
This comparison measures the indicator’s values over multiple time periods.<br>The Mann-Kendall Test for Statistical Significance is used to evaluate the trend<br>over 4 to 10 periods of measure, subject to data availability and comparability.
County: Harris Babies with Low Birthweight
County: Harris Babies with Low Birthweight
8.5%
(2015)
Compared to:
TX Counties
The distribution is based on data from 210 Texas counties.
TX Value
(8.2%)
The regional value is compared to the Texas State value.
US Value
(8.1%)
The regional value is compared to the national value. The source for the national value is Centers for Disease Control and Prevention
Prior Value
(8.5%)
Prior Value compares a measured value with the previously measured value. Confidence intervals were not taken into account in determining the direction of the comparison.
Trend
This comparison measures the indicator’s values over multiple time periods.<br>The Mann-Kendall Test for Statistical Significance is used to evaluate the trend<br>over 4 to 10 periods of measure, subject to data availability and comparability.
County: Harris Preterm Births
County: Harris Preterm Births
13.2%
(2019)
Compared to:
TX Counties
The distribution is based on data from 190 Texas counties.
TX Value
(13.0%)
The regional value is compared to the Texas State value.
Prior Value
(12.3%)
Prior Value compares a measured value with the previously measured value. Confidence intervals were not taken into account in determining the direction of the comparison.
Trend
This comparison measures the indicator’s values over multiple time periods.<br>The Mann-Kendall Test for Statistical Significance is used to evaluate the trend<br>over 4 to 10 periods of measure, subject to data availability and comparability.
HP 2030 Target
(9.4%)
County: Harris Mothers who Received Early Prenatal Care
County: Harris Mothers who Received Early Prenatal Care
48.9%
(2019)
Compared to:

TX Counties
The distribution is based on data from 253 Texas counties.
TX Value
(61.0%)
The regional value is compared to the Texas State value.
US Value
(75.8%)
The regional value is compared to the national value. The source for the national value is Centers for Disease Control and Prevention
Prior Value
(51.9%)
Prior Value compares a measured value with the previously measured value. Confidence intervals were not taken into account in determining the direction of the comparison.
Trend
This comparison measures the indicator’s values over multiple time periods.<br>The Mann-Kendall Test for Statistical Significance is used to evaluate the trend<br>over 4 to 10 periods of measure, subject to data availability and comparability.
County: Harris Infants Born to Mothers with <12 Years Education
County: Harris Infants Born to Mothers with <12 Years Education
20.3%
(2019)
Compared to:
TX Counties
The distribution is based on data from 209 Texas counties.
TX Value
(16.0%)
The regional value is compared to the Texas State value.
US Value
(12.1%)
The regional value is compared to the national value. The source for the national value is Centers for Disease Control and Prevention
Prior Value
(21.3%)
Prior Value compares a measured value with the previously measured value. Confidence intervals were not taken into account in determining the direction of the comparison.
Trend
This comparison measures the indicator’s values over multiple time periods.<br>The Mann-Kendall Test for Statistical Significance is used to evaluate the trend<br>over 4 to 10 periods of measure, subject to data availability and comparability.
County: Harris Teen Births
County: Harris Teen Births
1.7%
(2019)
Compared to:
TX Counties
(2014)
The distribution is based on data from 227 Texas counties.
TX Value
(2.0%)
The regional value is compared to the Texas State value.
US Value
(2.6%)
The regional value is compared to the national value. The source for the national value is Centers for Disease Control and Prevention, National Center for Health Statistics
Prior Value
(1.7%)
Prior Value compares a measured value with the previously measured value. Confidence intervals were not taken into account in determining the direction of the comparison.
Trend
This comparison measures the indicator’s values over multiple time periods.<br>The Mann-Kendall Test for Statistical Significance is used to evaluate the trend<br>over 4 to 10 periods of measure, subject to data availability and comparability.
