
Search for Indicators
All Data
Indicator Gauge Icon Legend
Legend Colors
Red is bad, green is good, blue is not statistically different/neutral.
Compared to Distribution
 the value is in the best half of communities.
 the value is in the 2nd worst quarter of communities.
 the value is in the worst quarter of communities.
Compared to Target
 meets target;
  does not meet target.
Compared to a Single Value
 lower than the comparison value;
 higher than the comparison value;
 not statistically different from comparison value.
Trend

 non-significant change over time;
 significant change over time;
  no change over time.
Compared to Prior Value
 higher than the previous measurement period;
 lower than the previous measurement period;
 no statistically different change from previous measurement period.
County: Harris
Health / Alcohol & Drug Use
Value
Compared to:
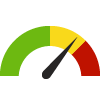
County: Harris Adults who Binge Drink
County: Harris Adults who Binge Drink
19.0%
(2021)
Compared to:


TX Value
(16.4%)
The regional value is compared to the Texas State value.
US Value
(15.4%)
The regional value is compared to the national value. The source for the national value is Behavioral Risk Factor Surveillance System
Prior Value
(18.6%)
Prior Value compares a measured value with the previously measured value. Confidence intervals were taken into account in determining the direction of the comparison.
Trend
This comparison measures the indicator’s values over multiple time periods.<br>The Mann-Kendall Test for Statistical Significance is used to evaluate the trend<br>over 4 to 10 periods of measure, subject to data availability and comparability.
County: Harris Age-Adjusted Drug and Opioid-Involved Overdose Death Rate
County: Harris Age-Adjusted Drug and Opioid-Involved Overdose Death Rate
14.5
Deaths per 100,000 population
(2018-2020)
Compared to:

U.S. Counties
The distribution is based on data from 1,303 U.S. counties and county equivalents.
TX Value
(11.8)
The regional value is compared to the Texas State value.
US Value
(23.5)
The regional value is compared to the national value.
Prior Value
(13.0)
Prior Value compares a measured value with the previously measured value. Confidence intervals were taken into account in determining the direction of the comparison.
County: Harris Death Rate due to Drug Poisoning
County: Harris Death Rate due to Drug Poisoning
18.2
Deaths per 100,000 population
(2019-2021)
Compared to:
U.S. Counties
The distribution is based on data from 1,899 U.S. counties and county equivalents.
TX Value
(14.0)
The regional value is compared to the Texas State value.
US Value
(27.2)
The regional value is compared to the national value.
HP 2030 Target
(20.7)
<div>SU-03: Reduce drug overdose deaths <strong>(LEADING HEALTH INDICATOR)</strong></div>
County: Harris
Health / Cancer
Value
Compared to:
County: Harris Adults with Cancer
County: Harris Adults with Cancer
5.2%
(2021)
Compared to:
TX Counties
The distribution is based on data from 254 Texas counties.
U.S. Counties
The distribution is based on data from 3,074 U.S. counties and county equivalents.
US Value
(7.0%)
The regional value is compared to the national value.
County: Harris Age-Adjusted Death Rate due to Breast Cancer
County: Harris Age-Adjusted Death Rate due to Breast Cancer
20.1
Deaths per 100,000 females
(2016-2020)
Compared to:
U.S. Counties
The distribution is based on data from 1,755 U.S. counties and county equivalents.
TX Value
(19.7)
The regional value is compared to the Texas State value.
US Value
(19.6)
The regional value is compared to the national value.
Prior Value
(21.0)
Prior Value compares a measured value with the previously measured value. Confidence intervals were taken into account in determining the direction of the comparison.
Trend
This comparison measures the indicator’s values over multiple time periods.<br>The Mann-Kendall Test for Statistical Significance is used to evaluate the trend<br>over 4 to 10 periods of measure, subject to data availability and comparability.
HP 2030 Target
(15.3)
County: Harris Age-Adjusted Death Rate due to Cancer
County: Harris Age-Adjusted Death Rate due to Cancer
139.4
Deaths per 100,000 population
(2016-2020)
Compared to:
TX Counties
The distribution is based on data from 243 Texas counties.
U.S. Counties
The distribution is based on data from 3,085 U.S. counties and county equivalents.
TX Value
(144.5)
The regional value is compared to the Texas State value.
US Value
(149.4)
The regional value is compared to the national value.
Prior Value
(141.6)
Prior Value compares a measured value with the previously measured value. Confidence intervals were taken into account in determining the direction of the comparison.
Trend
This comparison measures the indicator’s values over multiple time periods.<br>The Mann-Kendall Test for Statistical Significance is used to evaluate the trend<br>over 4 to 10 periods of measure, subject to data availability and comparability.
HP 2030 Target
(122.7)
County: Harris Age-Adjusted Death Rate due to Colorectal Cancer
County: Harris Age-Adjusted Death Rate due to Colorectal Cancer
13.4
Deaths per 100,000 population
(2016-2020)
Compared to:
TX Counties
The distribution is based on data from 147 Texas counties.
U.S. Counties
The distribution is based on data from 2,174 U.S. counties and county equivalents.
TX Value
(13.7)
The regional value is compared to the Texas State value.
US Value
(13.1)
The regional value is compared to the national value.
Prior Value
(13.5)
Prior Value compares a measured value with the previously measured value. Confidence intervals were taken into account in determining the direction of the comparison.
Trend
This comparison measures the indicator’s values over multiple time periods.<br>The Mann-Kendall Test for Statistical Significance is used to evaluate the trend<br>over 4 to 10 periods of measure, subject to data availability and comparability.
HP 2030 Target
(8.9)
County: Harris Age-Adjusted Death Rate due to Lung Cancer
County: Harris Age-Adjusted Death Rate due to Lung Cancer
27.9
Deaths per 100,000 population
(2016-2020)
Compared to:
TX Counties
The distribution is based on data from 188 Texas counties.
U.S. Counties
The distribution is based on data from 2,752 U.S. counties and county equivalents.
TX Value
(31.3)
The regional value is compared to the Texas State value.
US Value
(35.0)
The regional value is compared to the national value.
Prior Value
(29.5)
Prior Value compares a measured value with the previously measured value. Confidence intervals were taken into account in determining the direction of the comparison.
Trend
This comparison measures the indicator’s values over multiple time periods.<br>The Mann-Kendall Test for Statistical Significance is used to evaluate the trend<br>over 4 to 10 periods of measure, subject to data availability and comparability.
HP 2030 Target
(25.1)
County: Harris Age-Adjusted Death Rate due to Prostate Cancer
County: Harris Age-Adjusted Death Rate due to Prostate Cancer
18.6
Deaths per 100,000 males
(2016-2020)
Compared to:
U.S. Counties
The distribution is based on data from 1,576 U.S. counties and county equivalents.
TX Value
(17.6)
The regional value is compared to the Texas State value.
US Value
(18.8)
The regional value is compared to the national value.
Prior Value
(18.7)
Prior Value compares a measured value with the previously measured value. Confidence intervals were taken into account in determining the direction of the comparison.
Trend
This comparison measures the indicator’s values over multiple time periods.<br>The Mann-Kendall Test for Statistical Significance is used to evaluate the trend<br>over 4 to 10 periods of measure, subject to data availability and comparability.
HP 2030 Target
(16.9)
County: Harris All Cancer Incidence Rate
County: Harris All Cancer Incidence Rate
393.9
Cases per 100,000 population
(2016-2020)
Compared to:
TX Counties
The distribution is based on data from 251 Texas counties.
U.S. Counties
The distribution is based on data from 2,693 U.S. counties and county equivalents.
TX Value
(412.2)
The regional value is compared to the Texas State value.
US Value
(442.3)
The regional value is compared to the national value.
Prior Value
(397.3)
Prior Value compares a measured value with the previously measured value. Confidence intervals were taken into account in determining the direction of the comparison.
Trend
This comparison measures the indicator’s values over multiple time periods.<br>The Mann-Kendall Test for Statistical Significance is used to evaluate the trend<br>over 4 to 10 periods of measure, subject to data availability and comparability.
County: Harris Breast Cancer Incidence Rate
County: Harris Breast Cancer Incidence Rate
111.5
Cases per 100,000 females
(2016-2020)
Compared to:
TX Counties
The distribution is based on data from 203 Texas counties.
U.S. Counties
The distribution is based on data from 2,478 U.S. counties and county equivalents.
TX Value
(116.3)
The regional value is compared to the Texas State value.
US Value
(127.0)
The regional value is compared to the national value.
Prior Value
(113.4)
Prior Value compares a measured value with the previously measured value. Confidence intervals were taken into account in determining the direction of the comparison.
Trend
This comparison measures the indicator’s values over multiple time periods.<br>The Mann-Kendall Test for Statistical Significance is used to evaluate the trend<br>over 4 to 10 periods of measure, subject to data availability and comparability.
County: Harris Cancer: Medicare Population
County: Harris Cancer: Medicare Population
12.0%
(2022)
Compared to:

TX Counties
The distribution is based on data from 254 Texas counties.
U.S. Counties
The distribution is based on data from 3,129 U.S. counties and county equivalents.
TX Value
(11.0%)
The regional value is compared to the Texas State value.
US Value
(12.0%)
The regional value is compared to the national value.
Prior Value
(11.0%)
Prior Value compares a measured value with the previously measured value. Confidence intervals were not taken into account in determining the direction of the comparison.
Trend
This comparison measures the indicator’s values over multiple time periods.<br>The Mann-Kendall Test for Statistical Significance is used to evaluate the trend<br>over 4 to 10 periods of measure, subject to data availability and comparability.
County: Harris Cervical Cancer Incidence Rate
County: Harris Cervical Cancer Incidence Rate
9.8
Cases per 100,000 females
(2016-2020)
Compared to:
U.S. Counties
The distribution is based on data from 696 U.S. counties and county equivalents.
TX Value
(9.4)
The regional value is compared to the Texas State value.
US Value
(7.5)
The regional value is compared to the national value.
Prior Value
(10.1)
Prior Value compares a measured value with the previously measured value. Confidence intervals were taken into account in determining the direction of the comparison.
Trend
This comparison measures the indicator’s values over multiple time periods.<br>The Mann-Kendall Test for Statistical Significance is used to evaluate the trend<br>over 4 to 10 periods of measure, subject to data availability and comparability.
County: Harris Cervical Cancer Screening: 21-65
County: Harris Cervical Cancer Screening: 21-65
79.5%
(2020)
Compared to:

TX Counties
The distribution is based on data from 254 Texas counties.
U.S. Counties
The distribution is based on data from 3,141 U.S. counties and county equivalents.
US Value
(82.8%)
The regional value is compared to the national value.
County: Harris Colon Cancer Screening
County: Harris Colon Cancer Screening
55.4%
(2018)
Compared to:

TX Counties
The distribution is based on data from 254 Texas counties.
U.S. Counties
The distribution is based on data from 3,142 U.S. counties and county equivalents.
US Value
(66.4%)
The regional value is compared to the national value.
County: Harris Colon Cancer Screening: Sigmoidoscopy or Colonoscopy
County: Harris Colon Cancer Screening: Sigmoidoscopy or Colonoscopy
66.7%
(2018)
Compared to:
TX Value
(61.6%)
The regional value is compared to the Texas State value.
US Value
(69.3% in 2014)
The regional value is compared to the national value. The source for the national value is Behavioral Risk Factor Surveillance System
Prior Value
(57.6%)
Prior Value compares a measured value with the previously measured value. Confidence intervals were taken into account in determining the direction of the comparison.
County: Harris Colon Cancer Screening: USPSTF Recommendation
County: Harris Colon Cancer Screening: USPSTF Recommendation
65.0%
(2020)
Compared to:
TX Counties
The distribution is based on data from 254 Texas counties.
U.S. Counties
The distribution is based on data from 3,141 U.S. counties and county equivalents.
US Value
(72.4%)
The regional value is compared to the national value.
County: Harris Colorectal Cancer Incidence Rate
County: Harris Colorectal Cancer Incidence Rate
36.6
Cases per 100,000 population
(2016-2020)
Compared to:
TX Counties
The distribution is based on data from 192 Texas counties.
U.S. Counties
The distribution is based on data from 2,401 U.S. counties and county equivalents.
TX Value
(37.1)
The regional value is compared to the Texas State value.
US Value
(36.5)
The regional value is compared to the national value.
Prior Value
(37.2)
Prior Value compares a measured value with the previously measured value. Confidence intervals were taken into account in determining the direction of the comparison.
Trend
This comparison measures the indicator’s values over multiple time periods.<br>The Mann-Kendall Test for Statistical Significance is used to evaluate the trend<br>over 4 to 10 periods of measure, subject to data availability and comparability.
County: Harris Lung and Bronchus Cancer Incidence Rate
County: Harris Lung and Bronchus Cancer Incidence Rate
42.7
Cases per 100,000 population
(2016-2020)
Compared to:
TX Counties
The distribution is based on data from 198 Texas counties.
U.S. Counties
The distribution is based on data from 2,471 U.S. counties and county equivalents.
TX Value
(46.5)
The regional value is compared to the Texas State value.
US Value
(54.0)
The regional value is compared to the national value.
Prior Value
(44.2)
Prior Value compares a measured value with the previously measured value. Confidence intervals were taken into account in determining the direction of the comparison.
Trend
This comparison measures the indicator’s values over multiple time periods.<br>The Mann-Kendall Test for Statistical Significance is used to evaluate the trend<br>over 4 to 10 periods of measure, subject to data availability and comparability.
County: Harris Mammogram in Past 2 Years: 40+
County: Harris Mammogram in Past 2 Years: 40+
71.5%
(2020)
Compared to:

TX Value
(68.2%)
The regional value is compared to the Texas State value.
US Value
(71.5%)
The regional value is compared to the national value. The source for the national value is Behavioral Risk Factor Surveillance System
Prior Value
(71.5%)
Prior Value compares a measured value with the previously measured value. Confidence intervals were taken into account in determining the direction of the comparison.
Trend
This comparison measures the indicator’s values over multiple time periods.<br>The Mann-Kendall Test for Statistical Significance is used to evaluate the trend<br>over 4 to 10 periods of measure, subject to data availability and comparability.
County: Harris Mammogram in Past 2 Years: 50-74
County: Harris Mammogram in Past 2 Years: 50-74
72.7%
(2020)
Compared to:
TX Counties
The distribution is based on data from 254 Texas counties.
U.S. Counties
The distribution is based on data from 3,141 U.S. counties and county equivalents.
US Value
(78.2%)
The regional value is compared to the national value.
HP 2030 Target
(80.3%)
County: Harris Mammography Screening: Medicare Population
County: Harris Mammography Screening: Medicare Population
40.0%
(2022)
Compared to:
TX Counties
The distribution is based on data from 250 Texas counties.
U.S. Counties
The distribution is based on data from 3,123 U.S. counties and county equivalents.
TX Value
(42.0%)
The regional value is compared to the Texas State value.
US Value
(47.0%)
The regional value is compared to the national value.
Prior Value
(37.0%)
Prior Value compares a measured value with the previously measured value. Confidence intervals were not taken into account in determining the direction of the comparison.
Trend
This comparison measures the indicator’s values over multiple time periods.<br>The Mann-Kendall Test for Statistical Significance is used to evaluate the trend<br>over 4 to 10 periods of measure, subject to data availability and comparability.
County: Harris Oral Cavity and Pharynx Cancer Incidence Rate
County: Harris Oral Cavity and Pharynx Cancer Incidence Rate
10.1
Cases per 100,000 population
(2016-2020)
Compared to:
TX Counties
(2011-2015)
The distribution is based on data from 181 Texas counties.
U.S. Counties
The distribution is based on data from 1,706 U.S. counties and county equivalents.
TX Value
(11.2)
The regional value is compared to the Texas State value.
US Value
(11.9)
The regional value is compared to the national value.
Prior Value
(10.2)
Prior Value compares a measured value with the previously measured value. Confidence intervals were taken into account in determining the direction of the comparison.
Trend
This comparison measures the indicator’s values over multiple time periods.<br>The Mann-Kendall Test for Statistical Significance is used to evaluate the trend<br>over 4 to 10 periods of measure, subject to data availability and comparability.
County: Harris Pap Test in Past 3 Years
County: Harris Pap Test in Past 3 Years
75.0%
(2020)
Compared to:
TX Value
(66.8%)
The regional value is compared to the Texas State value.
US Value
(79.8% in 2016)
The regional value is compared to the national value. The source for the national value is Behavioral Risk Factor Surveillance System
Prior Value
(76.3%)
Prior Value compares a measured value with the previously measured value. Confidence intervals were taken into account in determining the direction of the comparison.
Trend
This comparison measures the indicator’s values over multiple time periods.<br>The Mann-Kendall Test for Statistical Significance is used to evaluate the trend<br>over 4 to 10 periods of measure, subject to data availability and comparability.
County: Harris Prostate Cancer Incidence Rate
County: Harris Prostate Cancer Incidence Rate
108.8
Cases per 100,000 males
(2016-2020)
Compared to:
TX Counties
The distribution is based on data from 201 Texas counties.
U.S. Counties
The distribution is based on data from 2,500 U.S. counties and county equivalents.
TX Value
(103.4)
The regional value is compared to the Texas State value.
US Value
(110.5)
The regional value is compared to the national value.
Prior Value
(107.9)
Prior Value compares a measured value with the previously measured value. Confidence intervals were taken into account in determining the direction of the comparison.
Trend
This comparison measures the indicator’s values over multiple time periods.<br>The Mann-Kendall Test for Statistical Significance is used to evaluate the trend<br>over 4 to 10 periods of measure, subject to data availability and comparability.
County: Harris
Health / Children's Health
Value
Compared to:
County: Harris Vaccine coverage rate for children 19-35 months
County: Harris Vaccine coverage rate for children 19-35 months
81.5%
(2016)
Compared to:
TX Value
(82.1%)
The regional value is compared to the Texas State value.
US Value
(84.6%)
The regional value is compared to the national value.
HP 2020 Target
(82.50%)
County: Harris
Health / Diabetes
Value
Compared to:
County: Harris Adults 20+ with Diabetes
County: Harris Adults 20+ with Diabetes
9.7%
(2021)
Compared to:
TX Counties
The distribution is based on data from 254 Texas counties.
U.S. Counties
The distribution is based on data from 3,074 U.S. counties and county equivalents.
Prior Value
(10.3%)
Prior Value compares a measured value with the previously measured value. Confidence intervals were taken into account in determining the direction of the comparison.
Trend
This comparison measures the indicator’s values over multiple time periods.<br>The Mann-Kendall Test for Statistical Significance is used to evaluate the trend<br>over 4 to 10 periods of measure, subject to data availability and comparability.
County: Harris Adults with Diabetes
County: Harris Adults with Diabetes
8.5%
(2021)
Compared to:

TX Value
(11.5%)
The regional value is compared to the Texas State value.
US Value
(10.9%)
The regional value is compared to the national value. The source for the national value is Behavioral Risk Factor Surveillance System
Prior Value
(13.7%)
Prior Value compares a measured value with the previously measured value. Confidence intervals were taken into account in determining the direction of the comparison.
Trend
This comparison measures the indicator’s values over multiple time periods.<br>The Mann-Kendall Test for Statistical Significance is used to evaluate the trend<br>over 4 to 10 periods of measure, subject to data availability and comparability.
County: Harris Age-Adjusted Death Rate due to Diabetes
County: Harris Age-Adjusted Death Rate due to Diabetes
21.6
Deaths per 100,000 population
(2018-2020)
Compared to:
TX Counties
The distribution is based on data from 133 Texas counties.
U.S. Counties
The distribution is based on data from 1,937 U.S. counties and county equivalents.
TX Value
(23.8)
The regional value is compared to the Texas State value.
US Value
(22.6)
The regional value is compared to the national value.
Prior Value
(20.4)
Prior Value compares a measured value with the previously measured value. Confidence intervals were taken into account in determining the direction of the comparison.
Trend
This comparison measures the indicator’s values over multiple time periods.<br>The Mann-Kendall Test for Statistical Significance is used to evaluate the trend<br>over 4 to 10 periods of measure, subject to data availability and comparability.
County: Harris Diabetes: Medicare Population
County: Harris Diabetes: Medicare Population
25.0%
(2022)
Compared to:
TX Counties
The distribution is based on data from 254 Texas counties.
U.S. Counties
The distribution is based on data from 3,129 U.S. counties and county equivalents.
TX Value
(25.0%)
The regional value is compared to the Texas State value.
US Value
(24.0%)
The regional value is compared to the national value.
Prior Value
(25.0%)
Prior Value compares a measured value with the previously measured value. Confidence intervals were not taken into account in determining the direction of the comparison.
Trend
This comparison measures the indicator’s values over multiple time periods.<br>The Mann-Kendall Test for Statistical Significance is used to evaluate the trend<br>over 4 to 10 periods of measure, subject to data availability and comparability.
County: Harris
Health / Disabilities
Value
Compared to:
County: Harris Adults with Disability Living in Poverty
County: Harris Adults with Disability Living in Poverty
22.6%
(2018-2022)
Compared to:
TX Counties
The distribution is based on data from 253 Texas counties.
U.S. Counties
The distribution is based on data from 3,132 U.S. counties and county equivalents.
TX Value
(22.0%)
The regional value is compared to the Texas State value.
US Value
(24.9%)
The regional value is compared to the national value.
Trend
This comparison measures the indicator’s values over multiple time periods.<br>The Mann-Kendall Test for Statistical Significance is used to evaluate the trend<br>over 4 to 10 periods of measure, subject to data availability and comparability.
County: Harris Children with a Disability
County: Harris Children with a Disability
4.2%
(2018-2022)
Compared to:


TX Value
(4.6%)
The regional value is compared to the Texas State value.
US Value
(4.5%)
The regional value is compared to the national value.
Trend
This comparison measures the indicator’s values over multiple time periods.<br>The Mann-Kendall Test for Statistical Significance is used to evaluate the trend<br>over 4 to 10 periods of measure, subject to data availability and comparability.
County: Harris Persons with a Cognitive Difficulty
County: Harris Persons with a Cognitive Difficulty
4.3%
(2018-2022)
Compared to:
TX Value
(4.8%)
The regional value is compared to the Texas State value.
US Value
(5.3%)
The regional value is compared to the national value.
Trend
This comparison measures the indicator’s values over multiple time periods.<br>The Mann-Kendall Test for Statistical Significance is used to evaluate the trend<br>over 4 to 10 periods of measure, subject to data availability and comparability.
County: Harris Persons with a Disability
County: Harris Persons with a Disability
10.0%
(2018-2022)
Compared to:
TX Value
(11.7%)
The regional value is compared to the Texas State value.
US Value
(12.9%)
The regional value is compared to the national value.
Trend
This comparison measures the indicator’s values over multiple time periods.<br>The Mann-Kendall Test for Statistical Significance is used to evaluate the trend<br>over 4 to 10 periods of measure, subject to data availability and comparability.
County: Harris Persons with a Hearing Difficulty
County: Harris Persons with a Hearing Difficulty
2.4%
(2018-2022)
Compared to:

TX Value
(3.3%)
The regional value is compared to the Texas State value.
US Value
(3.6%)
The regional value is compared to the national value.
Trend
This comparison measures the indicator’s values over multiple time periods.<br>The Mann-Kendall Test for Statistical Significance is used to evaluate the trend<br>over 4 to 10 periods of measure, subject to data availability and comparability.
County: Harris Persons with a Self-Care Difficulty
County: Harris Persons with a Self-Care Difficulty
2.1%
(2018-2022)
Compared to:
TX Value
(2.4%)
The regional value is compared to the Texas State value.
US Value
(2.6%)
The regional value is compared to the national value.
Trend
This comparison measures the indicator’s values over multiple time periods.<br>The Mann-Kendall Test for Statistical Significance is used to evaluate the trend<br>over 4 to 10 periods of measure, subject to data availability and comparability.
County: Harris Persons with a Vision Difficulty
County: Harris Persons with a Vision Difficulty
2.3%
(2018-2022)
Compared to:

TX Value
(2.5%)
The regional value is compared to the Texas State value.
US Value
(2.4%)
The regional value is compared to the national value.
Trend
This comparison measures the indicator’s values over multiple time periods.<br>The Mann-Kendall Test for Statistical Significance is used to evaluate the trend<br>over 4 to 10 periods of measure, subject to data availability and comparability.
County: Harris Persons with an Ambulatory Difficulty
County: Harris Persons with an Ambulatory Difficulty
5.2%
(2018-2022)
Compared to:
TX Value
(6.0%)
The regional value is compared to the Texas State value.
US Value
(6.7%)
The regional value is compared to the national value.
Trend
This comparison measures the indicator’s values over multiple time periods.<br>The Mann-Kendall Test for Statistical Significance is used to evaluate the trend<br>over 4 to 10 periods of measure, subject to data availability and comparability.
County: Harris
Health / Family Planning
Value
Compared to:
County: Harris Infants Born to Mothers with <12 Years Education
County: Harris Infants Born to Mothers with <12 Years Education
20.3%
(2019)
Compared to:
TX Counties
The distribution is based on data from 209 Texas counties.
TX Value
(16.0%)
The regional value is compared to the Texas State value.
US Value
(12.1%)
The regional value is compared to the national value. The source for the national value is Centers for Disease Control and Prevention
Prior Value
(21.3%)
Prior Value compares a measured value with the previously measured value. Confidence intervals were not taken into account in determining the direction of the comparison.
Trend
This comparison measures the indicator’s values over multiple time periods.<br>The Mann-Kendall Test for Statistical Significance is used to evaluate the trend<br>over 4 to 10 periods of measure, subject to data availability and comparability.
County: Harris Teen Births
County: Harris Teen Births
1.7%
(2019)
Compared to:
TX Counties
(2014)
The distribution is based on data from 227 Texas counties.
TX Value
(2.0%)
The regional value is compared to the Texas State value.
US Value
(2.6%)
The regional value is compared to the national value. The source for the national value is Centers for Disease Control and Prevention, National Center for Health Statistics
Prior Value
(1.7%)
Prior Value compares a measured value with the previously measured value. Confidence intervals were not taken into account in determining the direction of the comparison.
Trend
This comparison measures the indicator’s values over multiple time periods.<br>The Mann-Kendall Test for Statistical Significance is used to evaluate the trend<br>over 4 to 10 periods of measure, subject to data availability and comparability.
County: Harris
Health / Health Care Access & Quality
Value
Compared to:
County: Harris Adults Unable to Afford to See a Doctor
County: Harris Adults Unable to Afford to See a Doctor
16.1%
(2021)
Compared to:
TX Value
(15.9%)
The regional value is compared to the Texas State value.
Prior Value
(18.3%)
Prior Value compares a measured value with the previously measured value. Confidence intervals were taken into account in determining the direction of the comparison.
Trend
This comparison measures the indicator’s values over multiple time periods.<br>The Mann-Kendall Test for Statistical Significance is used to evaluate the trend<br>over 4 to 10 periods of measure, subject to data availability and comparability.
County: Harris Adults who have had a Routine Checkup
County: Harris Adults who have had a Routine Checkup
70.5%
(2021)
Compared to:
TX Counties
The distribution is based on data from 254 Texas counties.
U.S. Counties
The distribution is based on data from 3,074 U.S. counties and county equivalents.
US Value
(73.6%)
The regional value is compared to the national value.
County: Harris Adults with Health Insurance
County: Harris Adults with Health Insurance
73.0%
(2022)
Compared to:
U.S. Counties
The distribution is based on data from 828 U.S. counties and county equivalents.
TX Value
(77.6%)
The regional value is compared to the Texas State value.
US Value
(88.7%)
The regional value is compared to the national value.
Prior Value
(71.4%)
Prior Value compares a measured value with the previously measured value. Confidence intervals were taken into account in determining the direction of the comparison.
Trend
This comparison measures the indicator’s values over multiple time periods.<br>The Mann-Kendall Test for Statistical Significance is used to evaluate the trend<br>over 4 to 10 periods of measure, subject to data availability and comparability.
County: Harris Adults without Health Insurance
County: Harris Adults without Health Insurance
24.7%
(2021)
Compared to:
TX Counties
The distribution is based on data from 254 Texas counties.
U.S. Counties
The distribution is based on data from 3,074 U.S. counties and county equivalents.
US Value
(10.8%)
The regional value is compared to the national value.
County: Harris Children with Health Insurance
County: Harris Children with Health Insurance
87.2%
(2022)
Compared to:
U.S. Counties
The distribution is based on data from 828 U.S. counties and county equivalents.
TX Value
(89.1%)
The regional value is compared to the Texas State value.
US Value
(94.9%)
The regional value is compared to the national value.
Prior Value
(85.4%)
Prior Value compares a measured value with the previously measured value. Confidence intervals were taken into account in determining the direction of the comparison.
Trend
This comparison measures the indicator’s values over multiple time periods.<br>The Mann-Kendall Test for Statistical Significance is used to evaluate the trend<br>over 4 to 10 periods of measure, subject to data availability and comparability.
County: Harris Medicaid Enrollment
County: Harris Medicaid Enrollment
939,513
Number of persons
(2022)
Compared to:

Prior Value
(828,676)
Prior Value compares a measured value with the previously measured value. Confidence intervals were not taken into account in determining the direction of the comparison.
Trend
This comparison measures the indicator’s values over multiple time periods.<br>The Mann-Kendall Test for Statistical Significance is used to evaluate the trend<br>over 4 to 10 periods of measure, subject to data availability and comparability.
County: Harris Medicare Healthcare Costs
County: Harris Medicare Healthcare Costs
$11,597
Dollars per enrollee
(2015)
Compared to:


TX Value
($11,121)
The regional value is compared to the Texas State value.
US Value
($9,729)
The regional value is compared to the national value.
Prior Value
($11,669)
Prior Value compares a measured value with the previously measured value. Confidence intervals were not taken into account in determining the direction of the comparison.
Trend
This comparison measures the indicator’s values over multiple time periods.<br>The Mann-Kendall Test for Statistical Significance is used to evaluate the trend<br>over 4 to 10 periods of measure, subject to data availability and comparability.
County: Harris Non-Physician Primary Care Provider Rate
County: Harris Non-Physician Primary Care Provider Rate
121
Providers per 100,000 population
(2023)
Compared to:
TX Counties
The distribution is based on data from 252 Texas counties.
U.S. Counties
The distribution is based on data from 3,129 U.S. counties and county equivalents.
TX Value
(109)
The regional value is compared to the Texas State value.
Prior Value
(115)
Prior Value compares a measured value with the previously measured value. Confidence intervals were not taken into account in determining the direction of the comparison.
Trend
This comparison measures the indicator’s values over multiple time periods.<br>The Mann-Kendall Test for Statistical Significance is used to evaluate the trend<br>over 4 to 10 periods of measure, subject to data availability and comparability.
County: Harris Persons with Health Insurance
County: Harris Persons with Health Insurance
76.2%
(2021)
Compared to:

TX Counties
The distribution is based on data from 254 Texas counties.
U.S. Counties
The distribution is based on data from 3,140 U.S. counties and county equivalents.
TX Value
(79.7%)
The regional value is compared to the Texas State value.
Prior Value
(77.6%)
Prior Value compares a measured value with the previously measured value. Confidence intervals were taken into account in determining the direction of the comparison.
Trend
This comparison measures the indicator’s values over multiple time periods.<br>The Mann-Kendall Test for Statistical Significance is used to evaluate the trend<br>over 4 to 10 periods of measure, subject to data availability and comparability.
HP 2030 Target
(92.4%)
<div>AHS-01: Increase the proportion of people with health insurance <strong>(LEADING HEALTH INDICATOR)</strong></div>
County: Harris Persons with Private Health Insurance Only
County: Harris Persons with Private Health Insurance Only
50.0%
(2022)
Compared to:

TX Value
(53.8%)
The regional value is compared to the Texas State value.
US Value
(54.8%)
The regional value is compared to the national value.
Prior Value
(48.5%)
Prior Value compares a measured value with the previously measured value. Confidence intervals were not taken into account in determining the direction of the comparison.
Trend
This comparison measures the indicator’s values over multiple time periods.<br>The Mann-Kendall Test for Statistical Significance is used to evaluate the trend<br>over 4 to 10 periods of measure, subject to data availability and comparability.
County: Harris Persons with Public Health Insurance Only
County: Harris Persons with Public Health Insurance Only
22.8%
(2022)
Compared to:
TX Value
(20.6%)
The regional value is compared to the Texas State value.
US Value
(24.8%)
The regional value is compared to the national value.
Prior Value
(22.7%)
Prior Value compares a measured value with the previously measured value. Confidence intervals were not taken into account in determining the direction of the comparison.
Trend
This comparison measures the indicator’s values over multiple time periods.<br>The Mann-Kendall Test for Statistical Significance is used to evaluate the trend<br>over 4 to 10 periods of measure, subject to data availability and comparability.
County: Harris Preventable Hospital Stays: Medicare Population
County: Harris Preventable Hospital Stays: Medicare Population
3,113.0
Discharges per 100,000 Medicare enrollees
(2022)
Compared to:
TX Counties
The distribution is based on data from 254 Texas counties.
U.S. Counties
The distribution is based on data from 3,129 U.S. counties and county equivalents.
TX Value
(2,980.0)
The regional value is compared to the Texas State value.
US Value
(2,677.0)
The regional value is compared to the national value.
Prior Value
(3,056.0)
Prior Value compares a measured value with the previously measured value. Confidence intervals were not taken into account in determining the direction of the comparison.
Trend
This comparison measures the indicator’s values over multiple time periods.<br>The Mann-Kendall Test for Statistical Significance is used to evaluate the trend<br>over 4 to 10 periods of measure, subject to data availability and comparability.
County: Harris Primary Care Provider Rate
County: Harris Primary Care Provider Rate
58
Providers per 100,000 population
(2021)
Compared to:
TX Counties
The distribution is based on data from 231 Texas counties.
U.S. Counties
The distribution is based on data from 2,984 U.S. counties and county equivalents.
TX Value
(60)
The regional value is compared to the Texas State value.
Prior Value
(59)
Prior Value compares a measured value with the previously measured value. Confidence intervals were not taken into account in determining the direction of the comparison.
Trend
This comparison measures the indicator’s values over multiple time periods.<br>The Mann-Kendall Test for Statistical Significance is used to evaluate the trend<br>over 4 to 10 periods of measure, subject to data availability and comparability.
County: Harris
Health / Health Information Technology
Value
Compared to:
County: Harris Households with an Internet Subscription
County: Harris Households with an Internet Subscription
89.9%
(2018-2022)
Compared to:
TX Counties
The distribution is based on data from 254 Texas counties.
U.S. Counties
The distribution is based on data from 3,133 U.S. counties and county equivalents.
TX Value
(88.5%)
The regional value is compared to the Texas State value.
US Value
(88.5%)
The regional value is compared to the national value.
Trend
This comparison measures the indicator’s values over multiple time periods.<br>The Mann-Kendall Test for Statistical Significance is used to evaluate the trend<br>over 4 to 10 periods of measure, subject to data availability and comparability.
County: Harris Households with One or More Types of Computing Devices
County: Harris Households with One or More Types of Computing Devices
95.4%
(2018-2022)
Compared to:
TX Counties
The distribution is based on data from 254 Texas counties.
U.S. Counties
The distribution is based on data from 3,133 U.S. counties and county equivalents.
TX Value
(94.8%)
The regional value is compared to the Texas State value.
US Value
(94.0%)
The regional value is compared to the national value.
Trend
This comparison measures the indicator’s values over multiple time periods.<br>The Mann-Kendall Test for Statistical Significance is used to evaluate the trend<br>over 4 to 10 periods of measure, subject to data availability and comparability.
County: Harris Persons with an Internet Subscription
County: Harris Persons with an Internet Subscription
91.1%
(2018-2022)
Compared to:
TX Counties
The distribution is based on data from 254 Texas counties.
U.S. Counties
The distribution is based on data from 3,133 U.S. counties and county equivalents.
TX Value
(90.4%)
The regional value is compared to the Texas State value.
US Value
(91.0%)
The regional value is compared to the national value.
Trend
This comparison measures the indicator’s values over multiple time periods.<br>The Mann-Kendall Test for Statistical Significance is used to evaluate the trend<br>over 4 to 10 periods of measure, subject to data availability and comparability.
County: Harris
Health / Heart Disease & Stroke
Value
Compared to:
County: Harris Adults who Experienced a Stroke
County: Harris Adults who Experienced a Stroke
3.0%
(2021)
Compared to:
TX Counties
The distribution is based on data from 254 Texas counties.
U.S. Counties
The distribution is based on data from 3,074 U.S. counties and county equivalents.
US Value
(3.3%)
The regional value is compared to the national value.
County: Harris Adults who Experienced Coronary Heart Disease
County: Harris Adults who Experienced Coronary Heart Disease
5.2%
(2021)
Compared to:
TX Counties
The distribution is based on data from 254 Texas counties.
U.S. Counties
The distribution is based on data from 3,074 U.S. counties and county equivalents.
US Value
(6.1%)
The regional value is compared to the national value.
County: Harris Adults who Have Taken Medications for High Blood Pressure
County: Harris Adults who Have Taken Medications for High Blood Pressure
74.4%
(2021)
Compared to:
TX Counties
The distribution is based on data from 254 Texas counties.
U.S. Counties
The distribution is based on data from 3,074 U.S. counties and county equivalents.
US Value
(78.2%)
The regional value is compared to the national value.
40.6
Deaths per 100,000 population
(2018-2020)
Compared to:
TX Counties
The distribution is based on data from 155 Texas counties.
U.S. Counties
The distribution is based on data from 2,338 U.S. counties and county equivalents.
TX Value
(40.1)
The regional value is compared to the Texas State value.
US Value
(37.6)
The regional value is compared to the national value.
Prior Value
(40.6)
Prior Value compares a measured value with the previously measured value. Confidence intervals were taken into account in determining the direction of the comparison.
Trend
This comparison measures the indicator’s values over multiple time periods.<br>The Mann-Kendall Test for Statistical Significance is used to evaluate the trend<br>over 4 to 10 periods of measure, subject to data availability and comparability.
HP 2030 Target
(33.4)
County: Harris Age-Adjusted Death Rate due to Coronary Heart Disease
County: Harris Age-Adjusted Death Rate due to Coronary Heart Disease
86.6
Deaths per 100,000 population
(2018-2020)
Compared to:
TX Counties
The distribution is based on data from 207 Texas counties.
U.S. Counties
The distribution is based on data from 2,852 U.S. counties and county equivalents.
TX Value
(93.7)
The regional value is compared to the Texas State value.
US Value
(90.2)
The regional value is compared to the national value.
Prior Value
(85.3)
Prior Value compares a measured value with the previously measured value. Confidence intervals were taken into account in determining the direction of the comparison.
Trend
This comparison measures the indicator’s values over multiple time periods.<br>The Mann-Kendall Test for Statistical Significance is used to evaluate the trend<br>over 4 to 10 periods of measure, subject to data availability and comparability.
HP 2030 Target
(71.1)
County: Harris Age-Adjusted Death Rate due to Heart Attack
County: Harris Age-Adjusted Death Rate due to Heart Attack
42.9
Deaths per 100,000 population 35+ years
(2020)
Compared to:
TX Counties
The distribution is based on data from 140 Texas counties.
TX Value
(63.2)
The regional value is compared to the Texas State value.
Prior Value
(40.2)
Prior Value compares a measured value with the previously measured value. Confidence intervals were not taken into account in determining the direction of the comparison.
Trend
This comparison measures the indicator’s values over multiple time periods.<br>The Mann-Kendall Test for Statistical Significance is used to evaluate the trend<br>over 4 to 10 periods of measure, subject to data availability and comparability.
County: Harris Atrial Fibrillation: Medicare Population
County: Harris Atrial Fibrillation: Medicare Population
13.0%
(2022)
Compared to:
TX Counties
The distribution is based on data from 254 Texas counties.
U.S. Counties
The distribution is based on data from 3,129 U.S. counties and county equivalents.
TX Value
(14.0%)
The regional value is compared to the Texas State value.
US Value
(14.0%)
The regional value is compared to the national value.
Prior Value
(13.0%)
Prior Value compares a measured value with the previously measured value. Confidence intervals were not taken into account in determining the direction of the comparison.
Trend
This comparison measures the indicator’s values over multiple time periods.<br>The Mann-Kendall Test for Statistical Significance is used to evaluate the trend<br>over 4 to 10 periods of measure, subject to data availability and comparability.
County: Harris Cholesterol Test History
County: Harris Cholesterol Test History
82.9%
(2021)
Compared to:
TX Counties
The distribution is based on data from 254 Texas counties.
U.S. Counties
The distribution is based on data from 3,074 U.S. counties and county equivalents.
US Value
(86.4%)
The regional value is compared to the national value.
County: Harris Heart Failure: Medicare Population
County: Harris Heart Failure: Medicare Population
12.0%
(2022)
Compared to:
TX Counties
The distribution is based on data from 254 Texas counties.
U.S. Counties
The distribution is based on data from 3,129 U.S. counties and county equivalents.
TX Value
(12.0%)
The regional value is compared to the Texas State value.
US Value
(11.0%)
The regional value is compared to the national value.
Prior Value
(12.0%)
Prior Value compares a measured value with the previously measured value. Confidence intervals were not taken into account in determining the direction of the comparison.
Trend
This comparison measures the indicator’s values over multiple time periods.<br>The Mann-Kendall Test for Statistical Significance is used to evaluate the trend<br>over 4 to 10 periods of measure, subject to data availability and comparability.
County: Harris High Blood Pressure Prevalence
County: Harris High Blood Pressure Prevalence
28.0%
(2021)
Compared to:
TX Value
(32.2%)
The regional value is compared to the Texas State value.
Prior Value
(28.8%)
Prior Value compares a measured value with the previously measured value. Confidence intervals were taken into account in determining the direction of the comparison.
Trend
This comparison measures the indicator’s values over multiple time periods.<br>The Mann-Kendall Test for Statistical Significance is used to evaluate the trend<br>over 4 to 10 periods of measure, subject to data availability and comparability.
HP 2030 Target
(41.9%)
County: Harris High Cholesterol Prevalence
County: Harris High Cholesterol Prevalence
33.5%
(2021)
Compared to:
TX Value
(35.7%)
The regional value is compared to the Texas State value.
Prior Value
(37.3%)
Prior Value compares a measured value with the previously measured value. Confidence intervals were taken into account in determining the direction of the comparison.
Trend
This comparison measures the indicator’s values over multiple time periods.<br>The Mann-Kendall Test for Statistical Significance is used to evaluate the trend<br>over 4 to 10 periods of measure, subject to data availability and comparability.
County: Harris High Cholesterol Prevalence: Past 5 Years
County: Harris High Cholesterol Prevalence: Past 5 Years
34.5%
(2021)
Compared to:
TX Counties
The distribution is based on data from 254 Texas counties.
U.S. Counties
The distribution is based on data from 3,074 U.S. counties and county equivalents.
US Value
(36.4%)
The regional value is compared to the national value.
County: Harris Hyperlipidemia: Medicare Population
County: Harris Hyperlipidemia: Medicare Population
63.0%
(2022)
Compared to:
TX Counties
The distribution is based on data from 254 Texas counties.
U.S. Counties
The distribution is based on data from 3,129 U.S. counties and county equivalents.
TX Value
(65.0%)
The regional value is compared to the Texas State value.
US Value
(65.0%)
The regional value is compared to the national value.
Prior Value
(61.0%)
Prior Value compares a measured value with the previously measured value. Confidence intervals were not taken into account in determining the direction of the comparison.
Trend
This comparison measures the indicator’s values over multiple time periods.<br>The Mann-Kendall Test for Statistical Significance is used to evaluate the trend<br>over 4 to 10 periods of measure, subject to data availability and comparability.
County: Harris Hypertension: Medicare Population
County: Harris Hypertension: Medicare Population
64.0%
(2022)
Compared to:
TX Counties
The distribution is based on data from 254 Texas counties.
U.S. Counties
The distribution is based on data from 3,129 U.S. counties and county equivalents.
TX Value
(66.0%)
The regional value is compared to the Texas State value.
US Value
(65.0%)
The regional value is compared to the national value.
Prior Value
(64.0%)
Prior Value compares a measured value with the previously measured value. Confidence intervals were not taken into account in determining the direction of the comparison.
Trend
This comparison measures the indicator’s values over multiple time periods.<br>The Mann-Kendall Test for Statistical Significance is used to evaluate the trend<br>over 4 to 10 periods of measure, subject to data availability and comparability.
County: Harris Ischemic Heart Disease: Medicare Population
County: Harris Ischemic Heart Disease: Medicare Population
23.0%
(2022)
Compared to:
TX Counties
The distribution is based on data from 254 Texas counties.
U.S. Counties
The distribution is based on data from 3,129 U.S. counties and county equivalents.
TX Value
(22.0%)
The regional value is compared to the Texas State value.
US Value
(21.0%)
The regional value is compared to the national value.
Prior Value
(22.0%)
Prior Value compares a measured value with the previously measured value. Confidence intervals were not taken into account in determining the direction of the comparison.
Trend
This comparison measures the indicator’s values over multiple time periods.<br>The Mann-Kendall Test for Statistical Significance is used to evaluate the trend<br>over 4 to 10 periods of measure, subject to data availability and comparability.
County: Harris Stroke: Medicare Population
County: Harris Stroke: Medicare Population
7.0%
(2022)
Compared to:
TX Counties
The distribution is based on data from 254 Texas counties.
U.S. Counties
The distribution is based on data from 3,129 U.S. counties and county equivalents.
TX Value
(6.0%)
The regional value is compared to the Texas State value.
US Value
(6.0%)
The regional value is compared to the national value.
Prior Value
(7.0%)
Prior Value compares a measured value with the previously measured value. Confidence intervals were not taken into account in determining the direction of the comparison.
Trend
This comparison measures the indicator’s values over multiple time periods.<br>The Mann-Kendall Test for Statistical Significance is used to evaluate the trend<br>over 4 to 10 periods of measure, subject to data availability and comparability.
County: Harris
Health / Immunizations & Infectious Diseases
Value
Compared to:
County: Harris Adults 65+ with Influenza Vaccination
County: Harris Adults 65+ with Influenza Vaccination
68.7%
(2021)
Compared to:
TX Value
(66.0%)
The regional value is compared to the Texas State value.
US Value
(68.6%)
The regional value is compared to the national value. The source for the national value is Behavioral Risk Factor Surveillance System
Prior Value
(72.8%)
Prior Value compares a measured value with the previously measured value. Confidence intervals were taken into account in determining the direction of the comparison.
Trend
This comparison measures the indicator’s values over multiple time periods.<br>The Mann-Kendall Test for Statistical Significance is used to evaluate the trend<br>over 4 to 10 periods of measure, subject to data availability and comparability.
County: Harris Adults 65+ with Pneumonia Vaccination
County: Harris Adults 65+ with Pneumonia Vaccination
65.4%
(2021)
Compared to:
TX Value
(69.0%)
The regional value is compared to the Texas State value.
US Value
(71.0%)
The regional value is compared to the national value. The source for the national value is Behavioral Risk Factor Surveillance System
Prior Value
(72.7%)
Prior Value compares a measured value with the previously measured value. Confidence intervals were taken into account in determining the direction of the comparison.
Trend
This comparison measures the indicator’s values over multiple time periods.<br>The Mann-Kendall Test for Statistical Significance is used to evaluate the trend<br>over 4 to 10 periods of measure, subject to data availability and comparability.
County: Harris Age-Adjusted Death Rate due to Influenza and Pneumonia
County: Harris Age-Adjusted Death Rate due to Influenza and Pneumonia
11.7
Deaths per 100,000 population
(2018-2020)
Compared to:
U.S. Counties
The distribution is based on data from 1,449 U.S. counties and county equivalents.
TX Value
(12.1)
The regional value is compared to the Texas State value.
US Value
(13.4)
The regional value is compared to the national value.
Prior Value
(12.1)
Prior Value compares a measured value with the previously measured value. Confidence intervals were taken into account in determining the direction of the comparison.
Trend
This comparison measures the indicator’s values over multiple time periods.<br>The Mann-Kendall Test for Statistical Significance is used to evaluate the trend<br>over 4 to 10 periods of measure, subject to data availability and comparability.
County: Harris Conscientious Exemptions from Immunizations
County: Harris Conscientious Exemptions from Immunizations
1.4%
(2022-2023)
Compared to:
TX Counties
The distribution is based on data from 252 Texas counties.
TX Value
(2.0%)
The regional value is compared to the Texas State value.
Prior Value
(1.2%)
Prior Value compares a measured value with the previously measured value. Confidence intervals were not taken into account in determining the direction of the comparison.
Trend
This comparison measures the indicator’s values over multiple time periods.<br>The Mann-Kendall Test for Statistical Significance is used to evaluate the trend<br>over 4 to 10 periods of measure, subject to data availability and comparability.
County: Harris COVID-19 Daily Average Case-Fatality Rate
County: Harris COVID-19 Daily Average Case-Fatality Rate
0.6
Deaths per 100 cases
(Mar 3, 2023)
Compared to:
TX Counties
(Mar 11, 2022)
The distribution is based on data from 233 Texas counties.
U.S. Counties
(Mar 25, 2022)
The distribution is based on data from 2,811 U.S. counties and county equivalents.
TX Value
(1.8)
The regional value is compared to the Texas State value.
US Value
(1.7)
The regional value is compared to the national value.
Prior Value
(0.6)
Prior Value compares a measured value with the previously measured value. Confidence intervals were not taken into account in determining the direction of the comparison.
Trend
This comparison measures the indicator’s values over multiple time periods.<br>The Mann-Kendall Test for Statistical Significance is used to evaluate the trend<br>over 4 to 10 periods of measure, subject to data availability and comparability.
County: Harris COVID-19 Daily Average Incidence Rate
County: Harris COVID-19 Daily Average Incidence Rate
8.30
Cases per 100,000 population
(Mar 3, 2023)
Compared to:
TX Counties
The distribution is based on data from 254 Texas counties.
U.S. Counties
The distribution is based on data from 3,142 U.S. counties and county equivalents.
TX Value
(13.90)
The regional value is compared to the Texas State value.
US Value
(10.97)
The regional value is compared to the national value.
Prior Value
(7.61)
Prior Value compares a measured value with the previously measured value. Confidence intervals were not taken into account in determining the direction of the comparison.
Trend
This comparison measures the indicator’s values over multiple time periods.<br>The Mann-Kendall Test for Statistical Significance is used to evaluate the trend<br>over 4 to 10 periods of measure, subject to data availability and comparability.
County: Harris Flu Vaccinations: Medicare Population
County: Harris Flu Vaccinations: Medicare Population
49.0%
(2022)
Compared to:
TX Counties
The distribution is based on data from 254 Texas counties.
U.S. Counties
The distribution is based on data from 3,129 U.S. counties and county equivalents.
TX Value
(46.0%)
The regional value is compared to the Texas State value.
US Value
(50.0%)
The regional value is compared to the national value.
Prior Value
(47.0%)
Prior Value compares a measured value with the previously measured value. Confidence intervals were not taken into account in determining the direction of the comparison.
Trend
This comparison measures the indicator’s values over multiple time periods.<br>The Mann-Kendall Test for Statistical Significance is used to evaluate the trend<br>over 4 to 10 periods of measure, subject to data availability and comparability.
County: Harris Persons Fully Vaccinated Against COVID-19
County: Harris Persons Fully Vaccinated Against COVID-19
65.9%
(May 10, 2023)
Compared to:
TX Counties
The distribution is based on data from 254 Texas counties.
U.S. Counties
The distribution is based on data from 3,125 U.S. counties and county equivalents.
Prior Value
(65.9%)
Prior Value compares a measured value with the previously measured value. Confidence intervals were not taken into account in determining the direction of the comparison.
Trend
This comparison measures the indicator’s values over multiple time periods.<br>The Mann-Kendall Test for Statistical Significance is used to evaluate the trend<br>over 4 to 10 periods of measure, subject to data availability and comparability.
County: Harris Pneumonia Vaccinations: Medicare Population
County: Harris Pneumonia Vaccinations: Medicare Population
10.0%
(2022)
Compared to:

TX Counties
The distribution is based on data from 254 Texas counties.
U.S. Counties
The distribution is based on data from 3,129 U.S. counties and county equivalents.
TX Value
(8.0%)
The regional value is compared to the Texas State value.
US Value
(8.0%)
The regional value is compared to the national value.
Prior Value
(7.0%)
Prior Value compares a measured value with the previously measured value. Confidence intervals were not taken into account in determining the direction of the comparison.
Trend
This comparison measures the indicator’s values over multiple time periods.<br>The Mann-Kendall Test for Statistical Significance is used to evaluate the trend<br>over 4 to 10 periods of measure, subject to data availability and comparability.
County: Harris Reported AIDS Cases (Cumulative)
County: Harris Reported AIDS Cases (Cumulative)
33,084
Cases
(Q4 2019)
Compared to:
Prior Value
(32,990)
Prior Value compares a measured value with the previously measured value. Confidence intervals were not taken into account in determining the direction of the comparison.
Trend
This comparison measures the indicator’s values over multiple time periods.<br>The Mann-Kendall Test for Statistical Significance is used to evaluate the trend<br>over 4 to 10 periods of measure, subject to data availability and comparability.
County: Harris Reported HIV Cases (Cumulative)
County: Harris Reported HIV Cases (Cumulative)
29,865
Cases
(Q4 2019)
Compared to:
Prior Value
(29,670)
Prior Value compares a measured value with the previously measured value. Confidence intervals were not taken into account in determining the direction of the comparison.
Trend
This comparison measures the indicator’s values over multiple time periods.<br>The Mann-Kendall Test for Statistical Significance is used to evaluate the trend<br>over 4 to 10 periods of measure, subject to data availability and comparability.
County: Harris Tuberculosis Incidence Rate
County: Harris Tuberculosis Incidence Rate
5.7
Cases per 100,000 population
(2017-2021)
Compared to:
TX Counties
The distribution is based on data from 254 Texas counties.
TX Value
(3.9)
The regional value is compared to the Texas State value.
US Value
(2.4 in 2021)
The regional value is compared to the national value. The source for the national value is Centers for Disease Control and Prevention
Prior Value
(5.7)
Prior Value compares a measured value with the previously measured value. Confidence intervals were not taken into account in determining the direction of the comparison.
Trend
This comparison measures the indicator’s values over multiple time periods.<br>The Mann-Kendall Test for Statistical Significance is used to evaluate the trend<br>over 4 to 10 periods of measure, subject to data availability and comparability.
HP 2030 Target
(1.4)
County: Harris
Health / Maternal, Fetal & Infant Health
Value
Compared to:
County: Harris Babies with Low Birthweight
County: Harris Babies with Low Birthweight
8.5%
(2015)
Compared to:
TX Counties
The distribution is based on data from 210 Texas counties.
TX Value
(8.2%)
The regional value is compared to the Texas State value.
US Value
(8.1%)
The regional value is compared to the national value. The source for the national value is Centers for Disease Control and Prevention
Prior Value
(8.5%)
Prior Value compares a measured value with the previously measured value. Confidence intervals were not taken into account in determining the direction of the comparison.
Trend
This comparison measures the indicator’s values over multiple time periods.<br>The Mann-Kendall Test for Statistical Significance is used to evaluate the trend<br>over 4 to 10 periods of measure, subject to data availability and comparability.
County: Harris Babies with Very Low Birthweight
County: Harris Babies with Very Low Birthweight
1.5%
(2015)
Compared to:
TX Value
(1.4% in 2013)
The regional value is compared to the Texas State value.
US Value
(1.4%)
The regional value is compared to the national value. The source for the national value is Centers for Disease Control and Prevention
Prior Value
(1.5%)
Prior Value compares a measured value with the previously measured value. Confidence intervals were not taken into account in determining the direction of the comparison.
Trend
This comparison measures the indicator’s values over multiple time periods.<br>The Mann-Kendall Test for Statistical Significance is used to evaluate the trend<br>over 4 to 10 periods of measure, subject to data availability and comparability.
County: Harris Infant Mortality Rate
County: Harris Infant Mortality Rate
5.9
Deaths per 1,000 live births
(2019)
Compared to:
TX Counties
(2015)
The distribution is based on data from 165 Texas counties.
TX Value
(5.5)
The regional value is compared to the Texas State value.
US Value
(5.6)
The regional value is compared to the national value. The source for the national value is Centers for Disease Control and Prevention
Prior Value
(6.0)
Prior Value compares a measured value with the previously measured value. Confidence intervals were not taken into account in determining the direction of the comparison.
Trend
This comparison measures the indicator’s values over multiple time periods.<br>The Mann-Kendall Test for Statistical Significance is used to evaluate the trend<br>over 4 to 10 periods of measure, subject to data availability and comparability.
HP 2030 Target
(5.0)
<div>MICH-02: Reduce the rate of infant deaths <strong>(LEADING HEALTH INDICATOR)</strong></div>
County: Harris Mothers who Received Early Prenatal Care
County: Harris Mothers who Received Early Prenatal Care
48.9%
(2019)
Compared to:
TX Counties
The distribution is based on data from 253 Texas counties.
TX Value
(61.0%)
The regional value is compared to the Texas State value.
US Value
(75.8%)
The regional value is compared to the national value. The source for the national value is Centers for Disease Control and Prevention
Prior Value
(51.9%)
Prior Value compares a measured value with the previously measured value. Confidence intervals were not taken into account in determining the direction of the comparison.
Trend
This comparison measures the indicator’s values over multiple time periods.<br>The Mann-Kendall Test for Statistical Significance is used to evaluate the trend<br>over 4 to 10 periods of measure, subject to data availability and comparability.
County: Harris Preterm Births
County: Harris Preterm Births
13.2%
(2019)
Compared to:
TX Counties
The distribution is based on data from 190 Texas counties.
TX Value
(13.0%)
The regional value is compared to the Texas State value.
Prior Value
(12.3%)
Prior Value compares a measured value with the previously measured value. Confidence intervals were not taken into account in determining the direction of the comparison.
Trend
This comparison measures the indicator’s values over multiple time periods.<br>The Mann-Kendall Test for Statistical Significance is used to evaluate the trend<br>over 4 to 10 periods of measure, subject to data availability and comparability.
HP 2030 Target
(9.4%)
County: Harris
Health / Mental Health & Mental Disorders
Value
Compared to:
County: Harris Adults Ever Diagnosed with Depression
County: Harris Adults Ever Diagnosed with Depression
19.7%
(2021)
Compared to:
TX Counties
The distribution is based on data from 254 Texas counties.
U.S. Counties
The distribution is based on data from 3,074 U.S. counties and county equivalents.
US Value
(19.5%)
The regional value is compared to the national value.
County: Harris Age-Adjusted Death Rate due to Suicide
County: Harris Age-Adjusted Death Rate due to Suicide
10.7
Deaths per 100,000 population
(2018-2020)
Compared to:
U.S. Counties
The distribution is based on data from 1,307 U.S. counties and county equivalents.
TX Value
(13.5)
The regional value is compared to the Texas State value.
US Value
(13.9)
The regional value is compared to the national value.
Prior Value
(10.6)
Prior Value compares a measured value with the previously measured value. Confidence intervals were taken into account in determining the direction of the comparison.
Trend
This comparison measures the indicator’s values over multiple time periods.<br>The Mann-Kendall Test for Statistical Significance is used to evaluate the trend<br>over 4 to 10 periods of measure, subject to data availability and comparability.
HP 2030 Target
(12.8)
<div>MHMD-01: Reduce the suicide rate <strong>(LEADING HEALTH INDICATOR)</strong></div>
County: Harris Depression: Medicare Population
County: Harris Depression: Medicare Population
15.0%
(2022)
Compared to:
TX Counties
The distribution is based on data from 254 Texas counties.
U.S. Counties
The distribution is based on data from 3,129 U.S. counties and county equivalents.
TX Value
(17.0%)
The regional value is compared to the Texas State value.
US Value
(16.0%)
The regional value is compared to the national value.
Prior Value
(15.0%)
Prior Value compares a measured value with the previously measured value. Confidence intervals were not taken into account in determining the direction of the comparison.
Trend
This comparison measures the indicator’s values over multiple time periods.<br>The Mann-Kendall Test for Statistical Significance is used to evaluate the trend<br>over 4 to 10 periods of measure, subject to data availability and comparability.
County: Harris Frequent Mental Distress
County: Harris Frequent Mental Distress
13.1%
(2019)
Compared to:
TX Counties
The distribution is based on data from 254 Texas counties.
U.S. Counties
The distribution is based on data from 3,121 U.S. counties and county equivalents.
TX Value
(12.1%)
The regional value is compared to the Texas State value.
US Value
(14.0%)
The regional value is compared to the national value.
Prior Value
(12.7%)
Prior Value compares a measured value with the previously measured value. Confidence intervals were taken into account in determining the direction of the comparison.
County: Harris Mental Health Provider Rate
County: Harris Mental Health Provider Rate
163
Providers per 100,000 population
(2023)
Compared to:
TX Counties
The distribution is based on data from 220 Texas counties.
U.S. Counties
The distribution is based on data from 2,956 U.S. counties and county equivalents.
TX Value
(157)
The regional value is compared to the Texas State value.
Prior Value
(152)
Prior Value compares a measured value with the previously measured value. Confidence intervals were not taken into account in determining the direction of the comparison.
Trend
This comparison measures the indicator’s values over multiple time periods.<br>The Mann-Kendall Test for Statistical Significance is used to evaluate the trend<br>over 4 to 10 periods of measure, subject to data availability and comparability.
County: Harris Poor Mental Health: 14+ Days
County: Harris Poor Mental Health: 14+ Days
16.2%
(2021)
Compared to:
TX Counties
The distribution is based on data from 254 Texas counties.
U.S. Counties
The distribution is based on data from 3,074 U.S. counties and county equivalents.
US Value
(14.7%)
The regional value is compared to the national value.
County: Harris Poor Mental Health: 5+ Days
County: Harris Poor Mental Health: 5+ Days
27.0%
(2021)
Compared to:
TX Value
(26.4%)
The regional value is compared to the Texas State value.
Prior Value
(21.4%)
Prior Value compares a measured value with the previously measured value. Confidence intervals were taken into account in determining the direction of the comparison.
Trend
This comparison measures the indicator’s values over multiple time periods.<br>The Mann-Kendall Test for Statistical Significance is used to evaluate the trend<br>over 4 to 10 periods of measure, subject to data availability and comparability.
County: Harris Poor Mental Health: Average Number of Days
County: Harris Poor Mental Health: Average Number of Days
5.2
Days
(2021)
Compared to:
TX Counties
The distribution is based on data from 254 Texas counties.
U.S. Counties
The distribution is based on data from 3,141 U.S. counties and county equivalents.
TX Value
(4.6)
The regional value is compared to the Texas State value.
US Value
(4.8)
The regional value is compared to the national value.
Prior Value
(4.6)
Prior Value compares a measured value with the previously measured value. Confidence intervals were taken into account in determining the direction of the comparison.
Trend
This comparison measures the indicator’s values over multiple time periods.<br>The Mann-Kendall Test for Statistical Significance is used to evaluate the trend<br>over 4 to 10 periods of measure, subject to data availability and comparability.
County: Harris
Health / Mortality Data
Value
Compared to:
County: Harris Life Expectancy
County: Harris Life Expectancy
77.9
Years
(2019-2021)
Compared to:
TX Counties
The distribution is based on data from 237 Texas counties.
U.S. Counties
The distribution is based on data from 3,070 U.S. counties and county equivalents.
TX Value
(77.2)
The regional value is compared to the Texas State value.
US Value
(77.6)
The regional value is compared to the national value.
County: Harris
Health / Nutrition & Healthy Eating
Value
Compared to:
County: Harris Adult Fruit and Vegetable Consumption
County: Harris Adult Fruit and Vegetable Consumption
35.7%
(2017)
Compared to:
TX Value
(38.6%)
The regional value is compared to the Texas State value.
Prior Value
(18.7%)
Prior Value compares a measured value with the previously measured value. Confidence intervals were not taken into account in determining the direction of the comparison.
County: Harris
Health / Older Adults
Value
Compared to:
36.9%
(2020)
Compared to:
TX Counties
The distribution is based on data from 254 Texas counties.
U.S. Counties
The distribution is based on data from 3,141 U.S. counties and county equivalents.
US Value
(37.9%)
The regional value is compared to the national value.
37.0%
(2020)
Compared to:
TX Counties
The distribution is based on data from 254 Texas counties.
U.S. Counties
The distribution is based on data from 3,141 U.S. counties and county equivalents.
US Value
(43.7%)
The regional value is compared to the national value.
County: Harris Adults 65+ with a Disability
County: Harris Adults 65+ with a Disability
33.2%
(2018-2022)
Compared to:
TX Value
(35.6%)
The regional value is compared to the Texas State value.
US Value
(33.3%)
The regional value is compared to the national value.
Trend
This comparison measures the indicator’s values over multiple time periods.<br>The Mann-Kendall Test for Statistical Significance is used to evaluate the trend<br>over 4 to 10 periods of measure, subject to data availability and comparability.
County: Harris Adults 65+ with a Hearing Difficulty
County: Harris Adults 65+ with a Hearing Difficulty
12.2%
(2018-2022)
Compared to:
TX Value
(14.7%)
The regional value is compared to the Texas State value.
US Value
(13.7%)
The regional value is compared to the national value.
Trend
This comparison measures the indicator’s values over multiple time periods.<br>The Mann-Kendall Test for Statistical Significance is used to evaluate the trend<br>over 4 to 10 periods of measure, subject to data availability and comparability.
County: Harris Adults 65+ with a Self-Care Difficulty
County: Harris Adults 65+ with a Self-Care Difficulty
8.1%
(2018-2022)
Compared to:
TX Value
(8.2%)
The regional value is compared to the Texas State value.
US Value
(7.4%)
The regional value is compared to the national value.
Trend
This comparison measures the indicator’s values over multiple time periods.<br>The Mann-Kendall Test for Statistical Significance is used to evaluate the trend<br>over 4 to 10 periods of measure, subject to data availability and comparability.
County: Harris Adults 65+ with a Vision Difficulty
County: Harris Adults 65+ with a Vision Difficulty
7.2%
(2018-2022)
Compared to:
TX Value
(7.4%)
The regional value is compared to the Texas State value.
US Value
(6.0%)
The regional value is compared to the national value.
Trend
This comparison measures the indicator’s values over multiple time periods.<br>The Mann-Kendall Test for Statistical Significance is used to evaluate the trend<br>over 4 to 10 periods of measure, subject to data availability and comparability.
County: Harris Adults 65+ with an Independent Living Difficulty
County: Harris Adults 65+ with an Independent Living Difficulty
14.4%
(2018-2022)
Compared to:
TX Value
(14.4%)
The regional value is compared to the Texas State value.
US Value
(13.6%)
The regional value is compared to the national value.
Trend
This comparison measures the indicator’s values over multiple time periods.<br>The Mann-Kendall Test for Statistical Significance is used to evaluate the trend<br>over 4 to 10 periods of measure, subject to data availability and comparability.
County: Harris Age-Adjusted Death Rate due to Alzheimer's Disease
County: Harris Age-Adjusted Death Rate due to Alzheimer's Disease
31.8
Deaths per 100,000 population
(2018-2020)
Compared to:
TX Counties
The distribution is based on data from 160 Texas counties.
U.S. Counties
The distribution is based on data from 2,140 U.S. counties and county equivalents.
TX Value
(40.6)
The regional value is compared to the Texas State value.
US Value
(31.0)
The regional value is compared to the national value.
Prior Value
(30.9)
Prior Value compares a measured value with the previously measured value. Confidence intervals were taken into account in determining the direction of the comparison.
Trend
This comparison measures the indicator’s values over multiple time periods.<br>The Mann-Kendall Test for Statistical Significance is used to evaluate the trend<br>over 4 to 10 periods of measure, subject to data availability and comparability.
County: Harris Alzheimer's Disease or Dementia: Medicare Population
County: Harris Alzheimer's Disease or Dementia: Medicare Population
7.0%
(2022)
Compared to:
TX Counties
The distribution is based on data from 254 Texas counties.
U.S. Counties
The distribution is based on data from 3,129 U.S. counties and county equivalents.
TX Value
(7.0%)
The regional value is compared to the Texas State value.
US Value
(6.0%)
The regional value is compared to the national value.
Prior Value
(7.0%)
Prior Value compares a measured value with the previously measured value. Confidence intervals were not taken into account in determining the direction of the comparison.
Trend
This comparison measures the indicator’s values over multiple time periods.<br>The Mann-Kendall Test for Statistical Significance is used to evaluate the trend<br>over 4 to 10 periods of measure, subject to data availability and comparability.
County: Harris
Health / Oral Health
Value
Compared to:
County: Harris Adults 65+ with Total Tooth Loss
County: Harris Adults 65+ with Total Tooth Loss
12.2%
(2020)
Compared to:
TX Counties
The distribution is based on data from 254 Texas counties.
U.S. Counties
The distribution is based on data from 3,141 U.S. counties and county equivalents.
US Value
(13.4%)
The regional value is compared to the national value.
County: Harris Adults who Visited a Dentist
County: Harris Adults who Visited a Dentist
59.6%
(2012)
Compared to:
TX Value
(58.8%)
The regional value is compared to the Texas State value.
US Value
(67.2%)
The regional value is compared to the national value.
County: Harris Dentist Rate
County: Harris Dentist Rate
74
Dentists per 100,000 population
(2022)
Compared to:
TX Counties
The distribution is based on data from 242 Texas counties.
U.S. Counties
The distribution is based on data from 3,054 U.S. counties and county equivalents.
TX Value
(63)
The regional value is compared to the Texas State value.
Prior Value
(74)
Prior Value compares a measured value with the previously measured value. Confidence intervals were not taken into account in determining the direction of the comparison.
Trend
This comparison measures the indicator’s values over multiple time periods.<br>The Mann-Kendall Test for Statistical Significance is used to evaluate the trend<br>over 4 to 10 periods of measure, subject to data availability and comparability.
County: Harris
Health / Other Conditions
Value
Compared to:
County: Harris Adults with Arthritis
County: Harris Adults with Arthritis
19.1%
(2021)
Compared to:
TX Counties
The distribution is based on data from 254 Texas counties.
U.S. Counties
The distribution is based on data from 3,074 U.S. counties and county equivalents.
US Value
(25.2%)
The regional value is compared to the national value.
County: Harris Adults with Kidney Disease
County: Harris Adults with Kidney Disease
3.1%
(2021)
Compared to:
TX Counties
The distribution is based on data from 254 Texas counties.
U.S. Counties
The distribution is based on data from 3,074 U.S. counties and county equivalents.
US Value
(3.1%)
The regional value is compared to the national value.
County: Harris Chronic Kidney Disease: Medicare Population
County: Harris Chronic Kidney Disease: Medicare Population
18.0%
(2022)
Compared to:
TX Counties
The distribution is based on data from 254 Texas counties.
U.S. Counties
The distribution is based on data from 3,129 U.S. counties and county equivalents.
TX Value
(18.0%)
The regional value is compared to the Texas State value.
US Value
(18.0%)
The regional value is compared to the national value.
Prior Value
(18.0%)
Prior Value compares a measured value with the previously measured value. Confidence intervals were not taken into account in determining the direction of the comparison.
Trend
This comparison measures the indicator’s values over multiple time periods.<br>The Mann-Kendall Test for Statistical Significance is used to evaluate the trend<br>over 4 to 10 periods of measure, subject to data availability and comparability.
County: Harris Osteoporosis: Medicare Population
County: Harris Osteoporosis: Medicare Population
12.0%
(2022)
Compared to:
TX Counties
The distribution is based on data from 254 Texas counties.
U.S. Counties
The distribution is based on data from 3,129 U.S. counties and county equivalents.
TX Value
(11.0%)
The regional value is compared to the Texas State value.
US Value
(11.0%)
The regional value is compared to the national value.
Prior Value
(11.0%)
Prior Value compares a measured value with the previously measured value. Confidence intervals were not taken into account in determining the direction of the comparison.
Trend
This comparison measures the indicator’s values over multiple time periods.<br>The Mann-Kendall Test for Statistical Significance is used to evaluate the trend<br>over 4 to 10 periods of measure, subject to data availability and comparability.
County: Harris Rheumatoid Arthritis or Osteoarthritis: Medicare Population
County: Harris Rheumatoid Arthritis or Osteoarthritis: Medicare Population
32.0%
(2022)
Compared to:
TX Counties
The distribution is based on data from 254 Texas counties.
U.S. Counties
The distribution is based on data from 3,129 U.S. counties and county equivalents.
TX Value
(35.0%)
The regional value is compared to the Texas State value.
US Value
(35.0%)
The regional value is compared to the national value.
Prior Value
(30.0%)
Prior Value compares a measured value with the previously measured value. Confidence intervals were not taken into account in determining the direction of the comparison.
Trend
This comparison measures the indicator’s values over multiple time periods.<br>The Mann-Kendall Test for Statistical Significance is used to evaluate the trend<br>over 4 to 10 periods of measure, subject to data availability and comparability.
County: Harris
Health / Physical Activity
Value
Compared to:
County: Harris Adults 20+ who are Sedentary
County: Harris Adults 20+ who are Sedentary
21.3%
(2021)
Compared to:
TX Counties
The distribution is based on data from 254 Texas counties.
U.S. Counties
The distribution is based on data from 3,074 U.S. counties and county equivalents.
Prior Value
(21.0%)
Prior Value compares a measured value with the previously measured value. Confidence intervals were taken into account in determining the direction of the comparison.
Trend
This comparison measures the indicator’s values over multiple time periods.<br>The Mann-Kendall Test for Statistical Significance is used to evaluate the trend<br>over 4 to 10 periods of measure, subject to data availability and comparability.
County: Harris
Health / Prevention & Safety
Value
Compared to:
County: Harris Age-Adjusted Death Rate due to Falls
County: Harris Age-Adjusted Death Rate due to Falls
9.7
Deaths per 100,000 population
(2018-2020)
Compared to:
U.S. Counties
The distribution is based on data from 988 U.S. counties and county equivalents.
TX Value
(8.2)
The regional value is compared to the Texas State value.
US Value
(9.8)
The regional value is compared to the national value.
Prior Value
(9.4)
Prior Value compares a measured value with the previously measured value. Confidence intervals were taken into account in determining the direction of the comparison.
Trend
This comparison measures the indicator’s values over multiple time periods.<br>The Mann-Kendall Test for Statistical Significance is used to evaluate the trend<br>over 4 to 10 periods of measure, subject to data availability and comparability.
County: Harris Age-Adjusted Death Rate due to Firearms
County: Harris Age-Adjusted Death Rate due to Firearms
13.7
Deaths per 100,000 population
(2018-2020)
Compared to:
U.S. Counties
The distribution is based on data from 1,083 U.S. counties and county equivalents.
TX Value
(12.6)
The regional value is compared to the Texas State value.
US Value
(12.0)
The regional value is compared to the national value.
Prior Value
(12.8)
Prior Value compares a measured value with the previously measured value. Confidence intervals were taken into account in determining the direction of the comparison.
Trend
This comparison measures the indicator’s values over multiple time periods.<br>The Mann-Kendall Test for Statistical Significance is used to evaluate the trend<br>over 4 to 10 periods of measure, subject to data availability and comparability.
HP 2030 Target
(10.7)
County: Harris Age-Adjusted Death Rate due to Unintentional Injuries
County: Harris Age-Adjusted Death Rate due to Unintentional Injuries
42.0
Deaths per 100,000 population
(2018-2020)
Compared to:
TX Counties
The distribution is based on data from 164 Texas counties.
U.S. Counties
The distribution is based on data from 2,454 U.S. counties and county equivalents.
TX Value
(40.6)
The regional value is compared to the Texas State value.
US Value
(51.6)
The regional value is compared to the national value.
Prior Value
(39.2)
Prior Value compares a measured value with the previously measured value. Confidence intervals were taken into account in determining the direction of the comparison.
Trend
This comparison measures the indicator’s values over multiple time periods.<br>The Mann-Kendall Test for Statistical Significance is used to evaluate the trend<br>over 4 to 10 periods of measure, subject to data availability and comparability.
HP 2030 Target
(43.2)
County: Harris
Health / Respiratory Diseases
Value
Compared to:
County: Harris Adults with COPD
County: Harris Adults with COPD
6.0%
Percent of adults
(2021)
Compared to:
TX Counties
The distribution is based on data from 254 Texas counties.
U.S. Counties
The distribution is based on data from 3,074 U.S. counties and county equivalents.
US Value
(6.4%)
The regional value is compared to the national value.
County: Harris Adults with Current Asthma
County: Harris Adults with Current Asthma
7.0%
(2021)
Compared to:
TX Value
(8.4%)
The regional value is compared to the Texas State value.
US Value
(9.8%)
The regional value is compared to the national value. The source for the national value is Behavioral Risk Factor Surveillance System
Prior Value
(4.7%)
Prior Value compares a measured value with the previously measured value. Confidence intervals were taken into account in determining the direction of the comparison.
Trend
This comparison measures the indicator’s values over multiple time periods.<br>The Mann-Kendall Test for Statistical Significance is used to evaluate the trend<br>over 4 to 10 periods of measure, subject to data availability and comparability.
County: Harris Asthma: Medicare Population
County: Harris Asthma: Medicare Population
6.0%
(2022)
Compared to:
TX Counties
The distribution is based on data from 254 Texas counties.
U.S. Counties
The distribution is based on data from 3,129 U.S. counties and county equivalents.
TX Value
(7.0%)
The regional value is compared to the Texas State value.
US Value
(7.0%)
The regional value is compared to the national value.
Prior Value
(6.0%)
Prior Value compares a measured value with the previously measured value. Confidence intervals were not taken into account in determining the direction of the comparison.
Trend
This comparison measures the indicator’s values over multiple time periods.<br>The Mann-Kendall Test for Statistical Significance is used to evaluate the trend<br>over 4 to 10 periods of measure, subject to data availability and comparability.
County: Harris COPD: Medicare Population
County: Harris COPD: Medicare Population
10.0%
(2022)
Compared to:
TX Counties
The distribution is based on data from 254 Texas counties.
U.S. Counties
The distribution is based on data from 3,129 U.S. counties and county equivalents.
TX Value
(11.0%)
The regional value is compared to the Texas State value.
US Value
(11.0%)
The regional value is compared to the national value.
Prior Value
(10.0%)
Prior Value compares a measured value with the previously measured value. Confidence intervals were not taken into account in determining the direction of the comparison.
Trend
This comparison measures the indicator’s values over multiple time periods.<br>The Mann-Kendall Test for Statistical Significance is used to evaluate the trend<br>over 4 to 10 periods of measure, subject to data availability and comparability.
County: Harris
Health / Sexually Transmitted Infections
Value
Compared to:
County: Harris Chlamydia Incidence Rate
County: Harris Chlamydia Incidence Rate
583.5
Cases per 100,000 population
(2018)
Compared to:
TX Counties
The distribution is based on data from 254 Texas counties.
TX Value
(508.2)
The regional value is compared to the Texas State value.
US Value
(539.9)
The regional value is compared to the national value. The source for the national value is National Center for HIV/AIDS, Viral Hepatitis, STD, and TB Prevention
Prior Value
(571.4)
Prior Value compares a measured value with the previously measured value. Confidence intervals were not taken into account in determining the direction of the comparison.
Trend
This comparison measures the indicator’s values over multiple time periods.<br>The Mann-Kendall Test for Statistical Significance is used to evaluate the trend<br>over 4 to 10 periods of measure, subject to data availability and comparability.
County: Harris Gonorrhea Incidence Rate
County: Harris Gonorrhea Incidence Rate
185.8
Cases per 100,000 population
(2018)
Compared to:
TX Counties
The distribution is based on data from 254 Texas counties.
TX Value
(163.6)
The regional value is compared to the Texas State value.
US Value
(179.1)
The regional value is compared to the national value. The source for the national value is National Center for HIV/AIDS, Viral Hepatitis, STD, and TB Prevention
Prior Value
(182.1)
Prior Value compares a measured value with the previously measured value. Confidence intervals were not taken into account in determining the direction of the comparison.
Trend
This comparison measures the indicator’s values over multiple time periods.<br>The Mann-Kendall Test for Statistical Significance is used to evaluate the trend<br>over 4 to 10 periods of measure, subject to data availability and comparability.
County: Harris HIV Diagnosis Rate
County: Harris HIV Diagnosis Rate
24.9
Cases per 100,000 population
(2019)
Compared to:
TX Counties
The distribution is based on data from 254 Texas counties.
TX Value
(14.5)
The regional value is compared to the Texas State value.
Prior Value
(25.4)
Prior Value compares a measured value with the previously measured value. Confidence intervals were not taken into account in determining the direction of the comparison.
Trend
This comparison measures the indicator’s values over multiple time periods.<br>The Mann-Kendall Test for Statistical Significance is used to evaluate the trend<br>over 4 to 10 periods of measure, subject to data availability and comparability.
County: Harris Syphilis Incidence Rate
County: Harris Syphilis Incidence Rate
12.0
Cases per 100,000 population
(2018)
Compared to:
TX Value
(8.8)
The regional value is compared to the Texas State value.
US Value
(10.8)
The regional value is compared to the national value. The source for the national value is National Center for HIV/AIDS, Viral Hepatitis, STD, and TB Prevention
Prior Value
(7.0)
Prior Value compares a measured value with the previously measured value. Confidence intervals were not taken into account in determining the direction of the comparison.
Trend
This comparison measures the indicator’s values over multiple time periods.<br>The Mann-Kendall Test for Statistical Significance is used to evaluate the trend<br>over 4 to 10 periods of measure, subject to data availability and comparability.
County: Harris
Health / Tobacco Use
Value
Compared to:
County: Harris Adults who Smoke
County: Harris Adults who Smoke
13.4%
(2021)
Compared to:
TX Value
(13.1%)
The regional value is compared to the Texas State value.
Prior Value
(9.8%)
Prior Value compares a measured value with the previously measured value. Confidence intervals were taken into account in determining the direction of the comparison.
Trend
This comparison measures the indicator’s values over multiple time periods.<br>The Mann-Kendall Test for Statistical Significance is used to evaluate the trend<br>over 4 to 10 periods of measure, subject to data availability and comparability.
HP 2030 Target
(6.1%)
<div>TU-02: Reduce current cigarette smoking in adults <strong>(LEADING HEALTH INDICATOR)</strong></div>
County: Harris
Health / Weight Status
Value
Compared to:
County: Harris Adults 20+ Who Are Obese
County: Harris Adults 20+ Who Are Obese
34.3%
(2021)
Compared to:
TX Counties
The distribution is based on data from 254 Texas counties.
U.S. Counties
The distribution is based on data from 3,074 U.S. counties and county equivalents.
Prior Value
(32.6%)
Prior Value compares a measured value with the previously measured value. Confidence intervals were taken into account in determining the direction of the comparison.
Trend
This comparison measures the indicator’s values over multiple time periods.<br>The Mann-Kendall Test for Statistical Significance is used to evaluate the trend<br>over 4 to 10 periods of measure, subject to data availability and comparability.
HP 2030 Target
(36.0%)
County: Harris Adults Who Are Obese
County: Harris Adults Who Are Obese
33.5%
(2021)
Compared to:
TX Value
(36.1%)
The regional value is compared to the Texas State value.
US Value
(33.9%)
The regional value is compared to the national value. The source for the national value is Behavioral Risk Factor Surveillance System
Prior Value
(39.1%)
Prior Value compares a measured value with the previously measured value. Confidence intervals were taken into account in determining the direction of the comparison.
Trend
This comparison measures the indicator’s values over multiple time periods.<br>The Mann-Kendall Test for Statistical Significance is used to evaluate the trend<br>over 4 to 10 periods of measure, subject to data availability and comparability.
County: Harris Adults who are Overweight or Obese
County: Harris Adults who are Overweight or Obese
62.6%
(2021)
Compared to:
TX Value
(69.8%)
The regional value is compared to the Texas State value.
US Value
(68.3%)
The regional value is compared to the national value. The source for the national value is Behavioral Risk Factor Surveillance System
Prior Value
(67.1%)
Prior Value compares a measured value with the previously measured value. Confidence intervals were taken into account in determining the direction of the comparison.
Trend
This comparison measures the indicator’s values over multiple time periods.<br>The Mann-Kendall Test for Statistical Significance is used to evaluate the trend<br>over 4 to 10 periods of measure, subject to data availability and comparability.
County: Harris
Health / Wellness & Lifestyle
Value
Compared to:
County: Harris Frequent Physical Distress
County: Harris Frequent Physical Distress
13.0%
(2019)
Compared to:
TX Counties
The distribution is based on data from 254 Texas counties.
U.S. Counties
The distribution is based on data from 3,121 U.S. counties and county equivalents.
TX Value
(10.6%)
The regional value is compared to the Texas State value.
US Value
(12.0%)
The regional value is compared to the national value.
Prior Value
(12.7%)
Prior Value compares a measured value with the previously measured value. Confidence intervals were taken into account in determining the direction of the comparison.
County: Harris Insufficient Sleep
County: Harris Insufficient Sleep
33.7%
(2020)
Compared to:
TX Counties
The distribution is based on data from 253 Texas counties.
U.S. Counties
The distribution is based on data from 3,140 U.S. counties and county equivalents.
TX Value
(33.4%)
The regional value is compared to the Texas State value.
US Value
(33.0%)
The regional value is compared to the national value.
Prior Value
(37.8%)
Prior Value compares a measured value with the previously measured value. Confidence intervals were not taken into account in determining the direction of the comparison.
HP 2030 Target
(26.7%)
County: Harris Poor Physical Health: 14+ Days
County: Harris Poor Physical Health: 14+ Days
11.4%
(2021)
Compared to:
TX Counties
The distribution is based on data from 254 Texas counties.
U.S. Counties
The distribution is based on data from 3,074 U.S. counties and county equivalents.
US Value
(10.9%)
The regional value is compared to the national value.
County: Harris Poor Physical Health: 5+ Days
County: Harris Poor Physical Health: 5+ Days
12.5%
(2021)
Compared to:
TX Value
(17.8%)
The regional value is compared to the Texas State value.
Prior Value
(15.7%)
Prior Value compares a measured value with the previously measured value. Confidence intervals were taken into account in determining the direction of the comparison.
Trend
This comparison measures the indicator’s values over multiple time periods.<br>The Mann-Kendall Test for Statistical Significance is used to evaluate the trend<br>over 4 to 10 periods of measure, subject to data availability and comparability.
County: Harris Poor Physical Health: Average Number of Days
County: Harris Poor Physical Health: Average Number of Days
3.4
Days
(2021)
Compared to:
TX Counties
The distribution is based on data from 254 Texas counties.
U.S. Counties
The distribution is based on data from 3,141 U.S. counties and county equivalents.
TX Value
(3.3)
The regional value is compared to the Texas State value.
US Value
(3.3)
The regional value is compared to the national value.
Prior Value
(3.3)
Prior Value compares a measured value with the previously measured value. Confidence intervals were taken into account in determining the direction of the comparison.
Trend
This comparison measures the indicator’s values over multiple time periods.<br>The Mann-Kendall Test for Statistical Significance is used to evaluate the trend<br>over 4 to 10 periods of measure, subject to data availability and comparability.
County: Harris Self-Reported General Health Assessment: Good or Better
County: Harris Self-Reported General Health Assessment: Good or Better
78.6%
(2012)
Compared to:
TX Value
(80.8%)
The regional value is compared to the Texas State value.
US Value
(83.1%)
The regional value is compared to the national value.
Prior Value
(82.6%)
Prior Value compares a measured value with the previously measured value. Confidence intervals were taken into account in determining the direction of the comparison.
County: Harris Self-Reported General Health Assessment: Poor or Fair
County: Harris Self-Reported General Health Assessment: Poor or Fair
15.5%
(2021)
Compared to:
TX Value
(18.1%)
The regional value is compared to the Texas State value.
Prior Value
(14.4%)
Prior Value compares a measured value with the previously measured value. Confidence intervals were taken into account in determining the direction of the comparison.
Trend
This comparison measures the indicator’s values over multiple time periods.<br>The Mann-Kendall Test for Statistical Significance is used to evaluate the trend<br>over 4 to 10 periods of measure, subject to data availability and comparability.
County: Harris
Community / Civic Engagement
Value
Compared to:
County: Harris Voter Turnout: Presidential Election
County: Harris Voter Turnout: Presidential Election
65.9%
(2020)
Compared to:
TX Counties
(2016)
The distribution is based on data from 254 Texas counties.
TX Value
(66.7%)
The regional value is compared to the Texas State value.
Prior Value
(58.4%)
Prior Value compares a measured value with the previously measured value. Confidence intervals were not taken into account in determining the direction of the comparison.
Trend
This comparison measures the indicator’s values over multiple time periods.<br>The Mann-Kendall Test for Statistical Significance is used to evaluate the trend<br>over 4 to 10 periods of measure, subject to data availability and comparability.
HP 2030 Target
(58.4%)
<div>SDOH-07: Increase the proportion of the voting-age citizens who vote</div>
County: Harris
Community / Crime & Crime Prevention
Value
Compared to:
County: Harris Age-Adjusted Death Rate due to Homicide
County: Harris Age-Adjusted Death Rate due to Homicide
9.6
Deaths per 100,000 population
(2018-2020)
Compared to:
U.S. Counties
The distribution is based on data from 495 U.S. counties and county equivalents.
TX Value
(6.3)
The regional value is compared to the Texas State value.
US Value
(6.6)
The regional value is compared to the national value.
Prior Value
(8.5)
Prior Value compares a measured value with the previously measured value. Confidence intervals were taken into account in determining the direction of the comparison.
Trend
This comparison measures the indicator’s values over multiple time periods.<br>The Mann-Kendall Test for Statistical Significance is used to evaluate the trend<br>over 4 to 10 periods of measure, subject to data availability and comparability.
HP 2030 Target
(5.5)
<div>IVP-09: Reduce homicides <strong>(LEADING HEALTH INDICATOR)</strong></div>
County: Harris Violent Crime Rate
County: Harris Violent Crime Rate
730.4
Crimes per 100,000 population
(2014-2016)
Compared to:
TX Counties
The distribution is based on data from 253 Texas counties.
TX Value
(420.4)
The regional value is compared to the Texas State value.
US Value
(386.5)
The regional value is compared to the national value.
Prior Value
(713.7)
Prior Value compares a measured value with the previously measured value. Confidence intervals were not taken into account in determining the direction of the comparison.
Trend
This comparison measures the indicator’s values over multiple time periods.<br>The Mann-Kendall Test for Statistical Significance is used to evaluate the trend<br>over 4 to 10 periods of measure, subject to data availability and comparability.
County: Harris
Community / Demographics
Value
Compared to:
County: Harris Average Household Size
County: Harris Average Household Size
2.80
Persons per household
(2018-2022)
Compared to:
TX Value
(2.70)
The regional value is compared to the Texas State value.
US Value
(2.60)
The regional value is compared to the national value.
Trend
This comparison measures the indicator’s values over multiple time periods.<br>The Mann-Kendall Test for Statistical Significance is used to evaluate the trend<br>over 4 to 10 periods of measure, subject to data availability and comparability.
County: Harris Female Population
County: Harris Female Population
50.2%
(2022)
Compared to:
TX Value
(50.0%)
The regional value is compared to the Texas State value.
US Value
(50.4%)
The regional value is compared to the national value.
Prior Value
(50.1%)
Prior Value compares a measured value with the previously measured value. Confidence intervals were not taken into account in determining the direction of the comparison.
Trend
This comparison measures the indicator’s values over multiple time periods.<br>The Mann-Kendall Test for Statistical Significance is used to evaluate the trend<br>over 4 to 10 periods of measure, subject to data availability and comparability.
County: Harris Foreign Born Persons
County: Harris Foreign Born Persons
26.2%
(2018-2022)
Compared to:
TX Value
(17.1%)
The regional value is compared to the Texas State value.
US Value
(13.7%)
The regional value is compared to the national value.
Trend
This comparison measures the indicator’s values over multiple time periods.<br>The Mann-Kendall Test for Statistical Significance is used to evaluate the trend<br>over 4 to 10 periods of measure, subject to data availability and comparability.
County: Harris Households
County: Harris Households
1,692,896
Households
(2018-2022)
Compared to:
Trend
This comparison measures the indicator’s values over multiple time periods.<br>The Mann-Kendall Test for Statistical Significance is used to evaluate the trend<br>over 4 to 10 periods of measure, subject to data availability and comparability.
County: Harris Male Population
County: Harris Male Population
49.8%
(2022)
Compared to:
TX Value
(50.0%)
The regional value is compared to the Texas State value.
US Value
(49.6%)
The regional value is compared to the national value.
Prior Value
(49.9%)
Prior Value compares a measured value with the previously measured value. Confidence intervals were not taken into account in determining the direction of the comparison.
Trend
This comparison measures the indicator’s values over multiple time periods.<br>The Mann-Kendall Test for Statistical Significance is used to evaluate the trend<br>over 4 to 10 periods of measure, subject to data availability and comparability.
County: Harris Population 18+
County: Harris Population 18+
73.8%
(2018-2022)
Compared to:
TX Value
(74.7%)
The regional value is compared to the Texas State value.
US Value
(77.9%)
The regional value is compared to the national value.
Trend
This comparison measures the indicator’s values over multiple time periods.<br>The Mann-Kendall Test for Statistical Significance is used to evaluate the trend<br>over 4 to 10 periods of measure, subject to data availability and comparability.
44.8%
(2018-2022)
Compared to:
TX Value
(35.1%)
The regional value is compared to the Texas State value.
US Value
(21.7%)
The regional value is compared to the national value.
Trend
This comparison measures the indicator’s values over multiple time periods.<br>The Mann-Kendall Test for Statistical Significance is used to evaluate the trend<br>over 4 to 10 periods of measure, subject to data availability and comparability.
County: Harris Population American Indian and Alaska Native
County: Harris Population American Indian and Alaska Native
1.2%
(2022)
Compared to:
TX Value
(1.1%)
The regional value is compared to the Texas State value.
US Value
(1.3%)
The regional value is compared to the national value.
Prior Value
(1.1%)
Prior Value compares a measured value with the previously measured value. Confidence intervals were not taken into account in determining the direction of the comparison.
Trend
This comparison measures the indicator’s values over multiple time periods.<br>The Mann-Kendall Test for Statistical Significance is used to evaluate the trend<br>over 4 to 10 periods of measure, subject to data availability and comparability.
