
Search for Indicators
CHIP Sub-Priority 1.1: Behavioral Health
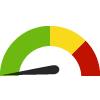
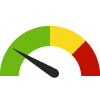
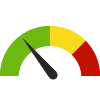
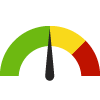
Indicator Gauge Icon Legend
Legend Colors
Red is bad, green is good, blue is not statistically different/neutral.
Compared to Distribution
 the value is in the best half of communities.
 the value is in the 2nd worst quarter of communities.
 the value is in the worst quarter of communities.
Compared to Target
 meets target;
  does not meet target.
Compared to a Single Value
 lower than the comparison value;
 higher than the comparison value;
 not statistically different from comparison value.
Trend

 non-significant change over time;
 significant change over time;
  no change over time.
Compared to Prior Value
 higher than the previous measurement period;
 lower than the previous measurement period;
 no statistically different change from previous measurement period.
Frequent Mental Distress
Value
Compared to:
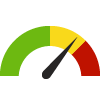
Frequent Mental Distress County: Harris
Frequent Mental Distress County: Harris
13.1%
(2019)
Compared to:

TX Counties
The distribution is based on data from 254 Texas counties.
U.S. Counties
The distribution is based on data from 3,121 U.S. counties and county equivalents.
TX Value
(12.1%)
The regional value is compared to the Texas State value.
US Value
(14.0%)
The regional value is compared to the national value.
Prior Value
(12.7%)
Prior Value compares a measured value with the previously measured value. Confidence intervals were taken into account in determining the direction of the comparison.
Poor Mental Health: 14+ Days
Value
Compared to:
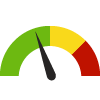
Poor Mental Health: 14+ Days County: Harris
Poor Mental Health: 14+ Days County: Harris
16.2%
(2021)
Compared to:
TX Counties
The distribution is based on data from 254 Texas counties.
U.S. Counties
The distribution is based on data from 3,074 U.S. counties and county equivalents.
US Value
(14.7%)
The regional value is compared to the national value.
Poor Mental Health: 14+ Days Census Place (City): Houston
Poor Mental Health: 14+ Days Census Place (City): Houston
17.6%
(2021)
Compared to:
TX Census Places
The distribution is based on data from 1,682 locales.
U.S. Census Places
The distribution is based on data from 27,528 U.S. Census Places.
Harris, TX County Value
(16.2%)
The regional value is compared to the Harris County value.
US Value
(14.7%)
The regional value is compared to the national value.
Poor Mental Health: 5+ Days
Value
Compared to:
Poor Mental Health: 5+ Days County: Harris
Poor Mental Health: 5+ Days County: Harris
27.0%
(2021)
Compared to:

TX Value
(26.4%)
The regional value is compared to the Texas State value.
Prior Value
(21.4%)
Prior Value compares a measured value with the previously measured value. Confidence intervals were taken into account in determining the direction of the comparison.
Trend
This comparison measures the indicator’s values over multiple time periods.<br>The Mann-Kendall Test for Statistical Significance is used to evaluate the trend<br>over 4 to 10 periods of measure, subject to data availability and comparability.
Poor Mental Health: Average Number of Days
Value
Compared to:
Poor Mental Health: Average Number of Days County: Harris
Poor Mental Health: Average Number of Days County: Harris
5.2
Days
(2021)
Compared to:
TX Counties
The distribution is based on data from 254 Texas counties.
U.S. Counties
The distribution is based on data from 3,141 U.S. counties and county equivalents.
TX Value
(4.6)
The regional value is compared to the Texas State value.
US Value
(4.8)
The regional value is compared to the national value.
Prior Value
(4.6)
Prior Value compares a measured value with the previously measured value. Confidence intervals were taken into account in determining the direction of the comparison.
Trend
This comparison measures the indicator’s values over multiple time periods.<br>The Mann-Kendall Test for Statistical Significance is used to evaluate the trend<br>over 4 to 10 periods of measure, subject to data availability and comparability.
