
Indicator Gauge Icon Legend
Legend Colors
Red is bad, green is good, blue is not statistically different/neutral.
Compared to Distribution
 the value is in the best half of communities.
 the value is in the 2nd worst quarter of communities.
 the value is in the worst quarter of communities.
Compared to Target
 meets target;
  does not meet target.
Compared to a Single Value
 lower than the comparison value;
 higher than the comparison value;
 not statistically different from comparison value.
Trend

 non-significant change over time;
 significant change over time;
  no change over time.
Compared to Prior Value
 higher than the previous measurement period;
 lower than the previous measurement period;
 no statistically different change from previous measurement period.
 Significantly better than the overall value
 Significantly worse than the overall value
 No significant difference with the overall value
 No data on significance available
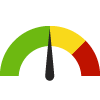
Adults Who Are Obese
This indicator is archived and is no longer being updated. Click to learn more
This indicator shows the percentage of adults aged 18 and older who are obese according to the Body Mass Index (BMI). The BMI is calculated by taking a person's weight and dividing it by their height squared in metric units (BMI = Weight (Kg)/[Height (m) ^ 2]). A BMI >=30 is considered obese.
Why is this important?
The percentage of obese adults is an indicator of the overall health and lifestyle of a community. Obesity increases the risk of many diseases and health conditions, including heart disease, type 2 diabetes, cancer, hypertension, stroke, liver and gallbladder disease, respiratory problems, and osteoarthritis. Losing weight and maintaining a healthy weight help to prevent and control these diseases. Being obese also carries significant economic costs due to increased healthcare spending and lost earnings.
Clear this location
37.7%
Source:
CDC - PLACES
Measurement period: 2021
Maintained by: Conduent Healthy Communities Institute
Last update: September 2023
Measurement period: 2021
Maintained by: Conduent Healthy Communities Institute
Last update: September 2023
Compared to

Technical note: Sub-county small area estimates use state and county data from the CDC's Behavioral Risk Factor Surveillance System (BRFSS) in tandem with demographic data for census tracts and cities. It is not appropriate to use this data for evaluation purposes.Census 2010 population counts and geographic boundaries data were used because corresponding Census 2020 population data are not available.
More details:
Graph Selections

| Census Place (City) | Source | Measurement Period | Percent | |
|---|---|---|---|---|
There are 46 Census Place (City) values. The lowest value is 26.7%, and the highest value is 44.4%.
Half of the values are between 30.9% and 37.8%.
The middle (median) value is 34%.
Data Sources
- Texas Behavioral Risk Factor Surveillance System
Maintained By: Conduent Healthy Communities Institute (Methodology)
Data source for Counties - CDC - PLACES
Note: This source uses Zip Code Tabulation Areas (ZCTAs) for its Zip Code data. Learn more
Maintained By: Conduent Healthy Communities Institute (Methodology)
Data source for Census Places (Cities), My Brother's Keeper Areas, Complete Communities, Neighborhoods, Zip Codes, Census Tracts
Note: Data for this indicator was obtained from multiple sources. Please interpret with caution as methodology may differ.
Filed under: Health / Weight Status, Health / Physical Activity, Health Status, Adults