
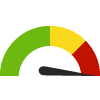
Indicator Gauge Icon Legend
Legend Colors
Red is bad, green is good, blue is not statistically different/neutral.
Compared to Distribution
 the value is in the best half of communities.
 the value is in the 2nd worst quarter of communities.
 the value is in the worst quarter of communities.
Compared to Target
 meets target;
  does not meet target.
Compared to a Single Value
 lower than the comparison value;
 higher than the comparison value;
 not statistically different from comparison value.
Trend

 non-significant change over time;
 significant change over time;
  no change over time.
Compared to Prior Value
 higher than the previous measurement period;
 lower than the previous measurement period;
 no statistically different change from previous measurement period.
 Significantly better than the overall value
 Significantly worse than the overall value
 No significant difference with the overall value
 No data on significance available
Adults who Have Taken Medications for High Blood Pressure
This indicator is archived and is no longer being updated. Click to learn more
This indicator shows the percentage of adults aged 18 or over with high blood pressure who report taking medications for high blood pressure.
Women who were diagnosed with high blood pressure only during the course of their pregnancy were not included.
Why is this important?
High blood pressure is the number one modifiable risk factor for stroke. In addition to stroke, high blood pressure also contributes to heart attacks, heart failure, kidney failure, and atherosclerosis. The higher your blood pressure, the greater your risk of heart attack, heart failure, stroke, and kidney disease. In the United States, one in three adults has high blood pressure, and nearly one-third of these people are not aware that they have it. Because there are no symptoms associated with high blood pressure, it is often called the "silent killer." The only way to tell if you have high blood pressure is to have your blood pressure checked. High blood pressure can occur in people of any age or sex; however, it is more common among those over age 35. It is particularly prevalent in African Americans, older adults, obese people, heavy drinkers, and women taking birth control pills. Blood pressure can be controlled through lifestyle changes, including eating a heart-healthy diet, limiting alcohol, avoiding tobacco, controlling your weight, and staying physically active.
Data presented here for the City of Houston represent an aggregation of ZIP Codes and are therefore not equivalent to data reported directly by the U.S. Census Bureau for "Houston city, Texas".
72.1%
Source:
CDC - PLACES
Measurement period: 2021
Maintained by: Conduent Healthy Communities Institute
Last update: September 2023
Measurement period: 2021
Maintained by: Conduent Healthy Communities Institute
Last update: September 2023
Compared to

Technical note: Sub-county small area estimates use state and county data from the CDC's Behavioral Risk Factor Surveillance System (BRFSS) in tandem with demographic data for census tracts and cities. It is not appropriate to use this data for evaluation purposes.Census 2010 population counts and geographic boundaries data were used because corresponding Census 2020 population data are not available.
More details:
Graph Selections

View maps, graphs, and tables for this indicator by selecting other location types (above).
In Houston, 74.4% of adults with high blood pressure have taken medication in the past year, which is higher than in Pasadena, and lower than Baytown and the U.S.
Data Source
- CDC - PLACES
Note: This source uses Zip Code Tabulation Areas (ZCTAs) for its Zip Code data. Learn more
Maintained By: Conduent Healthy Communities Institute (Methodology)
Filed under: Health / Heart Disease & Stroke, Health Behaviors, Health Status, Adults